In this article, we will explore the topic of indecisiveness in businesses. You will learn, among other things, what information silos are and what to do to ensure that aggregated data truly supports sound business decisions.
The Problem with Data Management: Information Silos
If, despite collecting large amounts of data, making a business decision in your company feels next to impossible – you're not alone!
Throughout our many years of collaboration with businesses of various sizes, we've observed a particular trend. Most modern managers are like ship captains with hundreds of advanced indicators on the bridge, but each displays data in a different unit (and half are hidden in lockers below deck, making it unclear when to use them).
This is the result of what are known as data silos – large collections of information that are not connected in any way. The lack of a single source of truth means that decisions are made 'by gut feeling', and hard data – instead of helping – becomes digital noise. Often, the problem isn't a lack of information, but its fragmentation.
In an ideal world, tools like CRM, warehouse management systems, or financial systems would be integrated into a single, cohesive entity. In reality, they often resemble foreign countries that don't speak each other's language. This leads to a situation where data interpretation is virtually impossible. For example, at one manufacturing company where we conducted an audit:
The warehouse is not integrated with other systems: Production needs square meters of material, but the warehouse issues it in rolls. Somewhere in the production manager's mind, there's a glimmer of information that 'two rolls are not enough for this order,' but the system doesn't know it. As a result, the machine stops because the material everyone thought was available ran out.
Quotes are created 'by guesswork': Salespeople prepare offers based on outdated price lists. They are unaware that electricity costs jumped by 15% last month, and a specific machine required expensive repairs. Without connecting financial data with production data, sales can unknowingly generate losses, even on 'large and prestigious' contracts.
Data entry processes are performed manually: Before employees can arrange transport, they must check: Has the client paid the advance? Has production completed the order? Has quality control approved the documents? Only then can they enter the delivery date. So, simply ordering a courier usually involves a series of phone calls, emails, and manual data processing, even though the data is already collected... just in five different places.
As you can see, the problem of lacking data integration isn't just about delays caused by time-consuming information searches, but also errors that can lead to financial losses. In the next section, let's explore what to do when your company has 'data' but gets no benefit from it.
Data Integration in One Place Instead of a Collection of Many Applications
The way to eliminate data silos is not to buy another expensive system that promises 'all-in-one.' The real power lies in integrations and the automation of information processing. It's precisely about connecting your current tools in such a way that data flows freely between them and forms a clear picture.
Thanks to tool integration, the systems your company already uses — for example, CRM, spreadsheets, or sales platforms — begin to exchange information according to clearly defined rules.
Utilizing data processing automation ensures that data is not manually copied from one place to another, but transmitted automatically: via APIs, connectors, integrators, or dedicated data exchange mechanisms. This way, information about a new order, a change in production status, current stock levels, or a paid invoice can reach where it's needed — without a phone call to another department and without searching through several applications.
The Key to Effective Data Management – System Architecture and Access Levels
It is crucial, however, that such a system should not be built haphazardly. Integration for integration's sake does not solve the problem if a sound data architecture is not planned beforehand. At the beginning of the project, it is necessary to clearly define which data sources are to be connected, which information is truly needed for decision-making, how often data should be refreshed, and who should have access to it. In other words: the rules of the game must be established:
Should inventory be updated hourly, daily, or in real-time?
Should all leads appear in the sales dashboard, or only those qualified by a salesperson?
Should the production cost include only material, or also labor hours, energy, waste, and machine servicing?
Only at this stage can a single source of truth be created — a place where data from various areas of the company is organized, standardized, and presented in a way that is understandable to business users. Most often, such a place is business dashboards, which are interactive panels that aggregate information from multiple systems and display it in a single application. Importantly, not everyone needs to see everything. A manager can have access to a strategic view: project profitability, resource utilization, production costs, sales forecasts, or margins. An operational employee might only see the data necessary for their daily work — for example, a task list, order status, material availability, or delivery deadlines.
Such a division of views and access levels ensures that data ceases to be chaotic.
Instead of sending multiple versions of Excel files between departments, the company works with the same set of information, but everyone views it from the perspective of their role.
For management board, this means greater business control; for managers, faster problem response; and for employees, less manual checking, transcribing, and querying.
Automating Business Reports as the Final Element of the Process
A significant value of such a solution is also report automation. If all key data is collected in one place, a report doesn't have to be created by copying numbers from five systems into one presentation. Automating the reporting process allows for cyclical preparation of summaries, according to pre-established rules. The dashboard can show current results in real-time, and additionally enables the automatic generation of reports in PDF format — for example, for management, the finance department, a client, or a business partner. Thanks to this, reporting ceases to be a time-consuming monthly obligation and becomes a natural element of company management.
Looking to implement data processing automation in your company? Contact us and take control of information chaos with modern solutions!
Why do we often start digital transformations by automating data processing?
It's also worth looking at data integration more broadly. Connecting systems and organizing information not only leads to better reports but also forms the foundation for further process automation.
When a company knows where its data is located, how it's described, and which data is reliable, it can start building automated processes that will lighten employees' workloads and accelerate the company's operations.
For example, if you can check the team's current hourly rate, specialist availability, the client's expected start date for collaboration, and the number of contracts awaiting preparation by administration all in one place, the system can then propose the nearest realistic project start date. Subsequently, with a single click, an employee can generate a message to the client. The automation will consider all necessary factors: staff availability, administrative workload, labor costs, and the preferred schedule. This means the employee doesn't have to manually jump between the CRM, calendar, pricing spreadsheet, and contract management system. Such data processing automation takes information from multiple sources and converts it into a specific recommendation or a ready-to-execute action – this way, you eliminate the problem of data silos, which we discussed in the first paragraph.
Similarly, automated data detection can work, allowing the system to independently identify specific events: a drop in margin below a set level, project budget overruns, production delays, low inventory levels, or an unusual increase in costs. In such a model, a company doesn't just "have data"; it actively starts using it. Data doesn't sit in systems waiting for someone to manually check it. It automatically triggers processes, alerts, reports, and decisions.
This is precisely why data integration should be treated as a long-term investment in how a company is managed, rather than merely a short-term technological project. A well-designed system of connected tools provides an organization with greater transparency, faster access to information, and a solid foundation for scaling automation. Instead of numerous applications operating in isolation, the company gains a single, cohesive ecosystem — with clear rules, organized data sources, and dashboards that support daily decisions.
Case study: Automating data processing and analysis for a manufacturing company
At the beginning of the article, we described an example of a manufacturing company that theoretically had access to a lot of data, but in practice, was unable to make quick decisions. Information about sales, production, inventory, finance, and logistics was scattered across different systems, meaning each department only saw a fragment of the overall picture. Our task was therefore not just to "connect the data," but to design a system that would genuinely streamline daily operations and help manage the company based on facts. Below you will find a list of problems our client faced, as well as the solutions we proposed.
Business decisions were made too late
One of the client's main challenges was the lack of a real-time view of the company's condition. Management had to wait for reports manually prepared by analysts or administrative staff. As a result, information about declining profitability, budget overruns, or problematic orders only surfaced when it was already difficult to react.
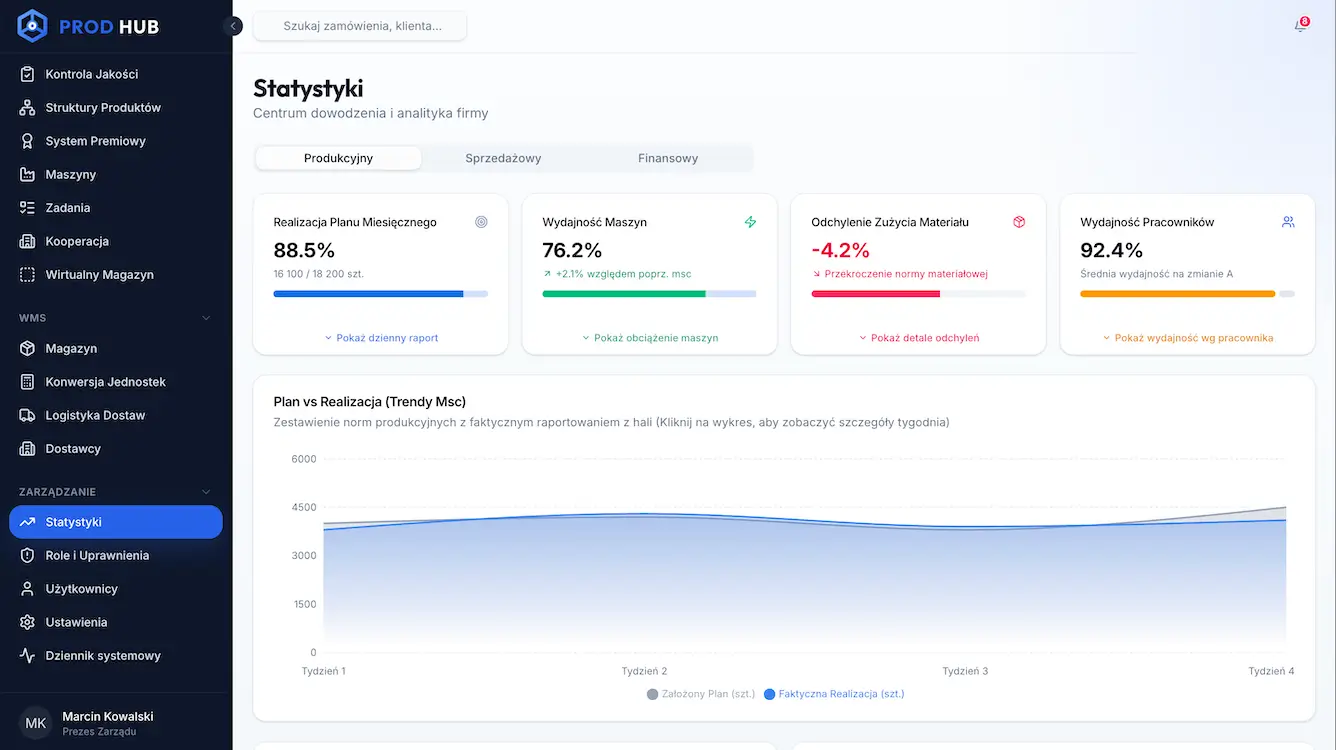
We proposed implementing business dashboards that aggregate data from various sources and display key indicators in near real-time. This data visualization meant that managers no longer had to wait until the end of the week or month to see what was happening in the company. A per-order margin view allows them to immediately identify orders that are "burning through" the budget or failing to meet sales targets.
Demo of a data visualization dashboard prepared for our client
If a specific order has a margin below target, the system immediately highlights this issue on the dashboard. The manager can then check whether the cause was an excessively low offer price, higher material consumption, machine downtime, production errors, or additional team working hours.
Lack of real-time view of the bonus system
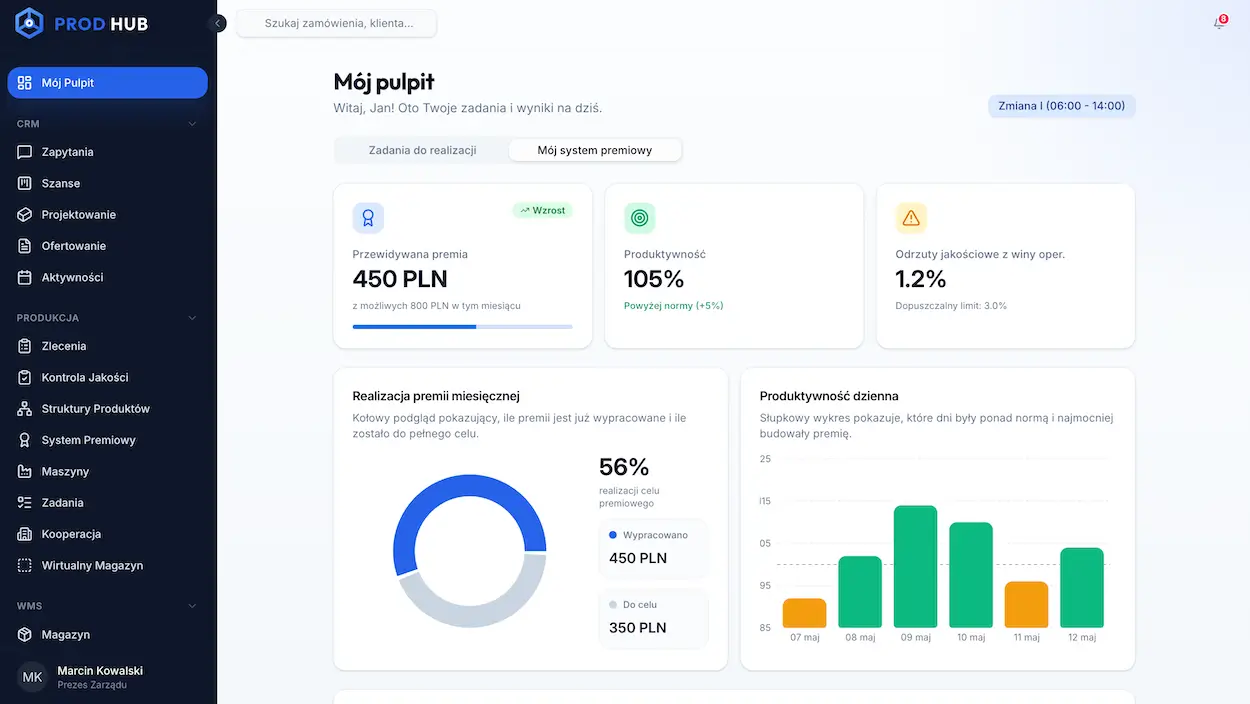
The second area that required streamlining was employee performance evaluation. The company had data on production efficiency, working hours, and order fulfillment, but this information was not presented to employees in a clear manner. This led to frustration, questions about bonus calculation methods, and a feeling that performance evaluation depended more on a supervisor's opinion than on concrete results.
We proposed creating separate dashboard views for operational employees. A machine operator can thus see on their tablet how their daily performance impacts plan fulfillment and their anticipated bonus. They don't have to wait until the end of the month to find out if their results were good. They see it in real-time, based on the same data that managers use. This method of presenting information supports healthy competition and increases team engagement.
Manual data processing during product shipment organization
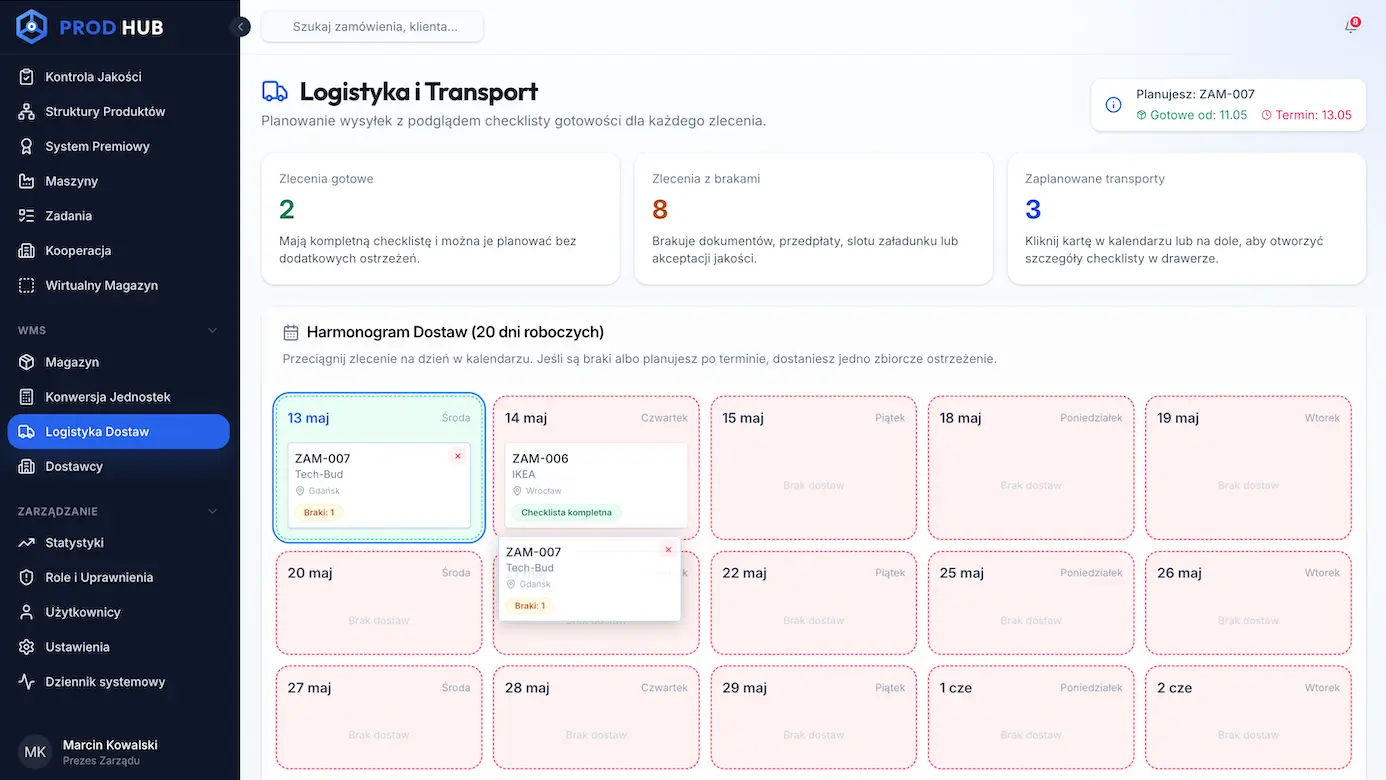
Shipment organization was also a problem for the company. The person responsible for transport had to manually check when goods needed to be dispatched, which in practice meant dozens of phone calls, emails, and constant switching between systems.
To accelerate shipment planning, we implemented an automated "logistics checklist" that gathers statuses from various departments and displays them in a single view. Each transport card functions like a set of traffic lights: green means a given condition has been met, red means something is still missing. If the system detects that quality control hasn't closed an order or documents haven't been completed, the shipment isn't marked as ready. This way, the logistics employee doesn't have to inquire with each department separately. They immediately see which orders can be handed over for transport and which still require action.
Salespeople wasted time manually processing data from inquiries
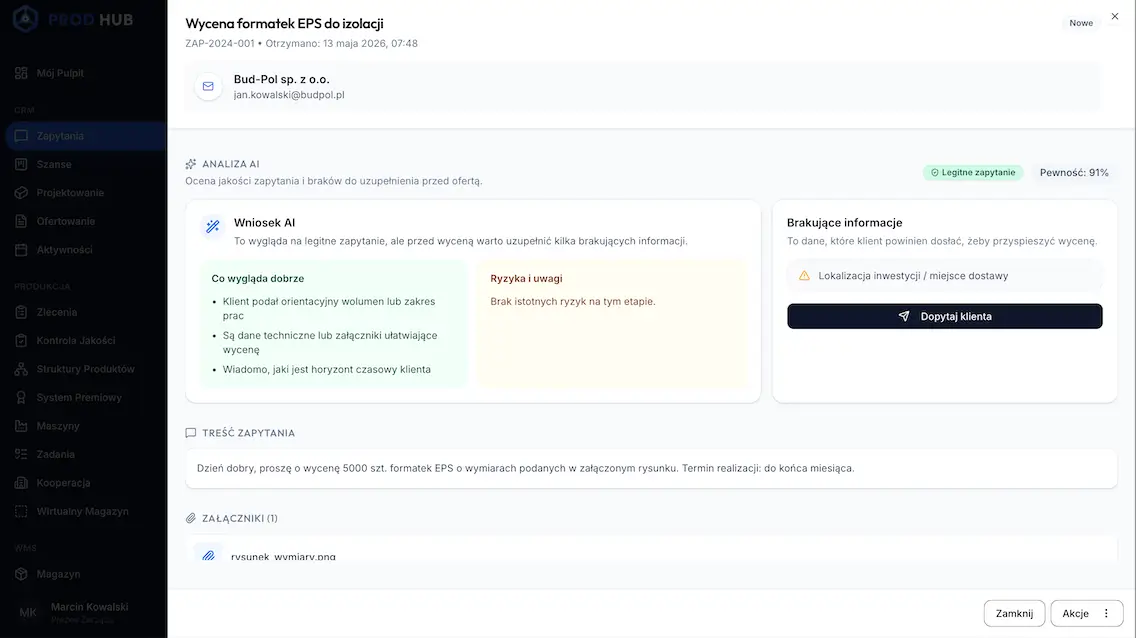
Another challenge was handling quotation inquiries. The company received many messages from potential clients, but some were incomplete, vague, or required further clarification of basic information. Salespeople therefore spent a lot of time analyzing emails, filling in missing data, and assessing which inquiries were truly worth a quick response.
We proposed using AI as a quality filter for inquiries. The system can analyze the content of emails and contact forms, check data completeness, and assess whether an inquiry contains key information needed to prepare an offer. It can detect a missing delivery address, an unclear scope of order, a missing deadline, or other data that a salesperson previously had to manually verify. Thanks to this solution, salespeople can focus on clients who are genuinely ready for a sales conversation. AI doesn't replace the salesperson in building relationships, but it relieves them of repetitive, preliminary inquiry screening.
The company didn't know why the plan diverged from reality
The most important element of the entire project was creating a feedback loop between the plan and the actual outcome. The company prepared quotes, planned budgets, and assumed specific margins, but after an order was completed, it was difficult to quickly check why the actual result differed from the assumptions. Financial, production, inventory, and sales data were scattered, so analyzing the causes required manually combining information.
We proposed implementing a mechanism that automatically compares assumptions with facts. The system compares the planned budget with actual revenue and costs, then shows where deviations occurred. If a specific type of order consistently performs worse than the pricing model assumed, the company receives a clear signal that the quoting algorithm needs updating.
Such a solution allows verifying whether quotes account for real costs: rising electricity prices, higher material consumption, longer working hours for a specific type of order, production shortages, or additional logistical costs. As a result, the company doesn't have to guess why the month-end result differs from the plan. It sees the specific causes and can more quickly improve its quoting methodology.
The company's profitability data was analyzed too generally
Before implementing integration, the company viewed profitability mainly from the perspective of overall sales or financial results. This provided a certain picture of the situation but didn't answer the most important question: which specific orders, service types, or customer groups were truly profitable?
We proposed automated per-order profitability reporting. By combining data from production, inventory, logistics, sales, and finance, the system can show the margin for a specific order, not just for the entire month or department. It takes into account actual material consumption, real working hours, production shortages, transport costs, and the time salespeople spent closing the deal. This way, the company can make decisions at a much more precise level. It can check which orders are profitable, which require a pricing adjustment, and which might be worth foregoing. This is especially important in manufacturing companies, where a "big contract" doesn't always mean a good contract — especially if it consumes a lot of resources and generates a low margin.
Lack of real-time financial data analysis capabilities
The final challenge was response time. The board and managers only received a fuller picture of the situation after month-end closing, often following accounting analysis and manual preparation of statements. In practice, this meant that due to a lack of predictive analysis, decisions were made post-factum — when the problem had already impacted the financial outcome.
We proposed implementing a near real-time reporting system for the client. The CEO and managers can daily see the current financial result, plan fulfillment progress, order profitability, production load, and potential risks. This allows the company to adjust its course on an ongoing basis, rather than two months later when a change in decision no longer impacts completed orders. It is precisely here that the automation of data processing and analysis shows its greatest value. The company not only receives reports faster, but most importantly, can make decisions faster. And in practice, this means fewer losses, better resource utilization, and greater control over what is truly happening within the organization.
From information to smart business decisions through data automation
Having data is standard today. However, a competitive advantage is only built when that data starts working together.
At Sagiton, we believe that the role of technology is to lift the burden from people's shoulders. Automating the reporting process using tools like n8n or Make allows silos to be connected into a single, efficient mechanism. As a result, a salesperson knows the true cost of an hour of labor, a logistics specialist knows when to order a vehicle, and the CEO knows how much they earned... as of this morning, not two months after the accounting close.
Join our newsletter
Subscribe and receive additional content, checklists and business automation tips from us.
Thank you for subscribing to our newsletter!
You will soon receive a welcome message at the email address you provided.
Oops! Something went wrong, failed to send the form.
Is your data working for you, or are you working to collect it?
We'd love to discuss how to connect the dots in your business and transform scattered Excel sheets into a clear command center. Contact us to schedule a free consultation with our reporting automation consultant.
Too many business tools? See How Automation Organizes Data
An overabundance of SaaS tools often leads to data dispersion, increased costs, and decreased operational efficiency. In the article, we explain how to organize the flow of information and build a scalable work environment through the automation of business processes.
Read more
Business automation
09.06.2026
sales-reporting
Sales reporting — how to reduce the time to create reports?
Read our article to learn how to implement effective sales reports that your team won't have to spend tens of hours a month on preparing.
Read more
Business automation
09.06.2026
management-reporting-what-is-it
Management reporting — what is it and how does it work? 3 examples of reports
Read our article and learn what management reporting is and what role process automation plays in data management. Get to know 3 real business examples.
Read more
Napisz do nas!
Select the topic you are interested in in the form and our specialist will contact you within 24 working hours.
Thank you for contacting us!
Your message has been successfully sent. We will reply as soon as possible.
Oops! Something went wrong, failed to send the form.


.webp)