Read our article and learn what management reporting is and what role process automation plays in data management. Get to know 3 real business examples.
If you are an entrepreneur, you know that the more your business grows, the more more decisions need to be made. When you run a business where only a few people work, approving a budget or evaluating the effectiveness of an employee comes easily. However, the problem begins when the company and the operational processes begin to develop dynamically as it often happens in business.
In such a situation, the people who manage the organization gradually lose full control over the information. It is this problem that management reports solve.
A management report is nothing more than a structured set of data needed to make business decisions, often presented in a visual form. Allows you to quickly view key indicators such as KPI (Key Performance Indicators).
For example, marketing managers who have access to up-to-date conversion rate data can make informed decisions to increase or decrease advertising budgets.
Basic types of management reports
Among the different types of reports, one can distinguish those that have a particular impact on the decisions made in the strategic areas of the company:
reports for financial departments,
reports with revenue forecasts,
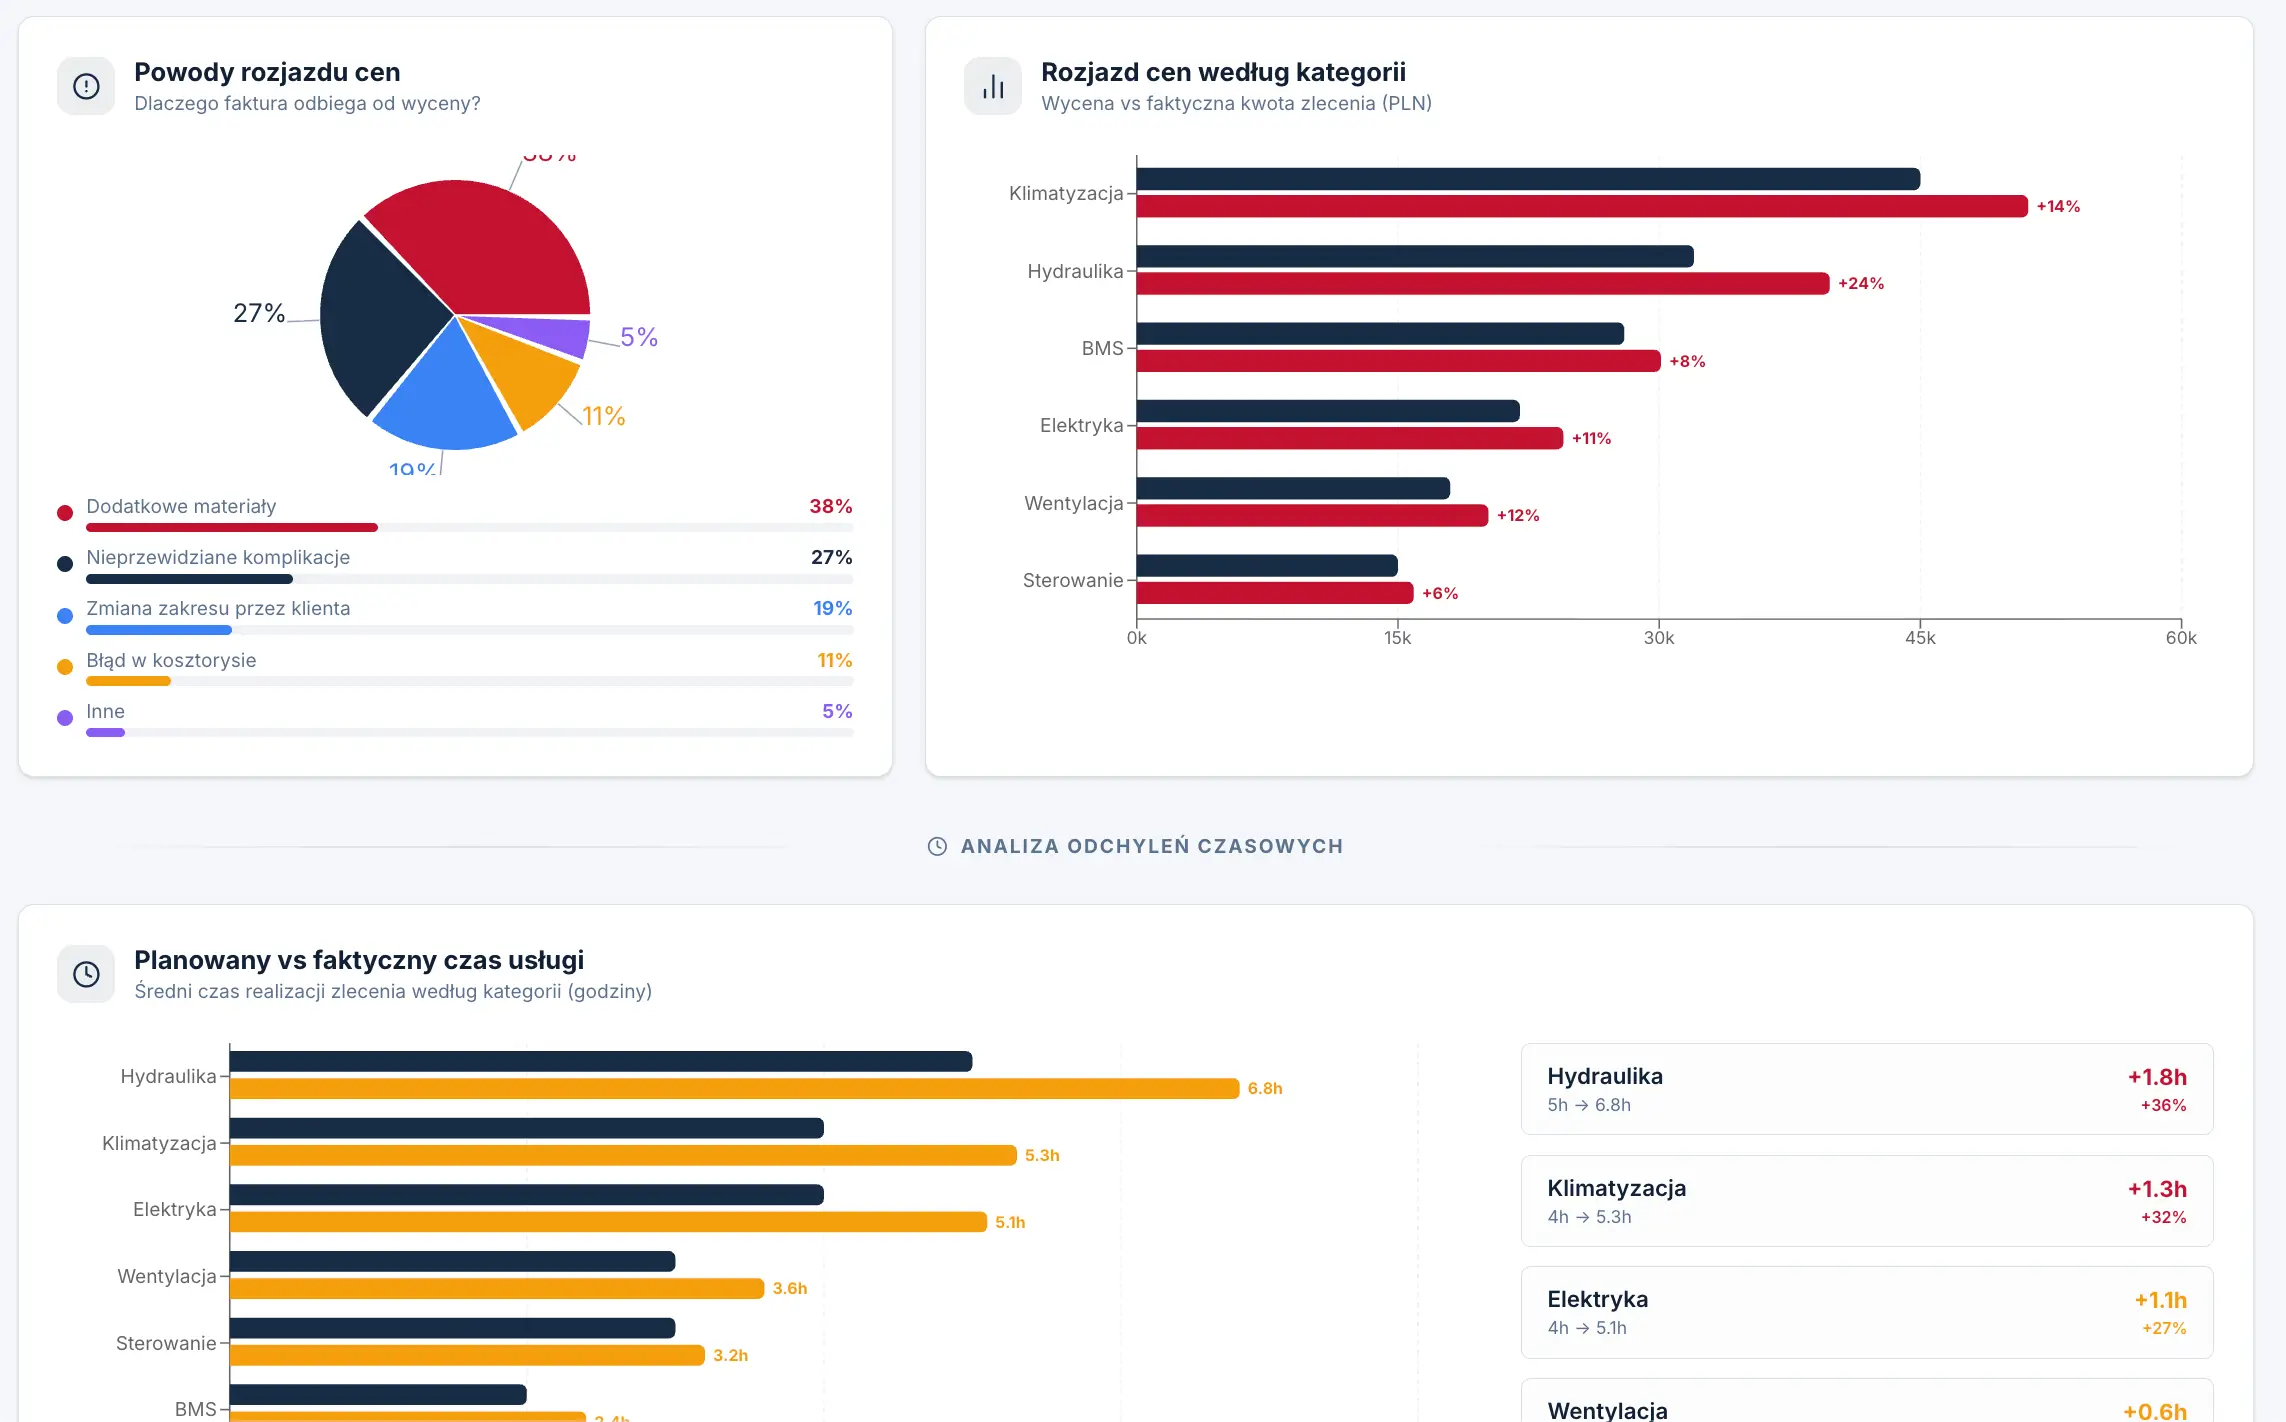
dashboards for monitoring KPI indicators — comparing set goals to actual results e.g. (planned time and material consumption vs. actual time and consumption),
graphs that allow analyzing the effectiveness of employees,
margin monitoring.
However, it should be remembered that these are only examples. Management reports should always be adjusted not only to the specifics of the company's activities, but also to its current needs.
For example, if in the project implementation department all tasks are completed on time, and the profitability of employees is not in doubt, it is worth turning your attention to other areas - for example, personnel and wages, where it is not always clear what exactly the working time is allocated for.
An example of a management report showing the differences between planned values and actual implementation
In the companies of our clients, it also often turns out that the management information that would feed the reports is simply missing. Therefore, it is also important to design the entire process of collecting this data - for example, implement a panel in which the production worker will have the opportunity to indicate the reason for the absence. The processes of aggregation of various types of indicators are possible thanks to the integrations of business tools, due to which automatic data flows are formed. You can read more about automation in the next paragraph.
Automation and efficiency of reports
Why is automation so often discussed in the context of management reporting? Until recently, reporting to management took 8 hours of employees work on a certain day – they were reparing and delivering data to managers manually.
Why? So the decision makers could focus solely on analyzing the data, not on the painstaking preparation of it. It takes so much time for certain reasons — the data does not appear by itself in the form of a clear report with graphs. You need to first collect, organize, process and present it, and often it is additionally scattered in different tools and systems. We wrote more about this challenge in the article: https://www.sagiton.pl/en/blog/organising-tools-and-data-in-the-companies
The solution to this problem is automation of processes. Thanks to integrations and automatic data flows, reports can be updated on their own, without the need to manually prepare subsequent versions. Dashboards are available in real time, and access to up-to-date information does not require waiting.
Completing and visualizing data is no longer time-consuming, so companies can make better use of their resources and focus on strategic actions. Modern management reporting is based on automatic aggregation of data from many sources — we will return to how to prepare an automated reporting system later in the article.
The most important benefits of reporting automation are:
Time saving — elimination of manual collection, copying and preparation of data (e.g. many hours of work on reports).
Real-time data — dashboards update automatically, without having to wait for a new version of the report.
Higher data quality — no errors resulting from manual processing (e.g. copying data between Excel sheets).
In the next paragraph, you will see how we have helped our clients from various industries implement effective management reporting.
What does automated management reporting look like in practice? 3 implementations for our clients
As a Sagiton automation agency, we are mainly engaged in providing automated IT systems that help our clients execute business processes better and faster. Almost in each of our projects there is a module that allows analysis and comparison of data from different IT tools. However, there are also projects in which the main objective is implementation of automatic management reporting. We will tell you about them in 3 short case studies, which you will find below.
Do you want to implement automated reporting tools in your company? Get in touch with us!
Project for a manufacturing company: Report on the efficiency of employees and the consumption of machines and materials
A client with a single production facility initially assumed that automation of production management is a solution intended exclusively for large organizations.
In order to dispel the doubts of the client, we offered them a strategy of process mapping across the company — from planning of production to shipment — to identify areas where improvements will bring the greatest benefit.
After analyzing the company's business, we started implementing a solution based on analytical dashboards that would allow access to key information such as:
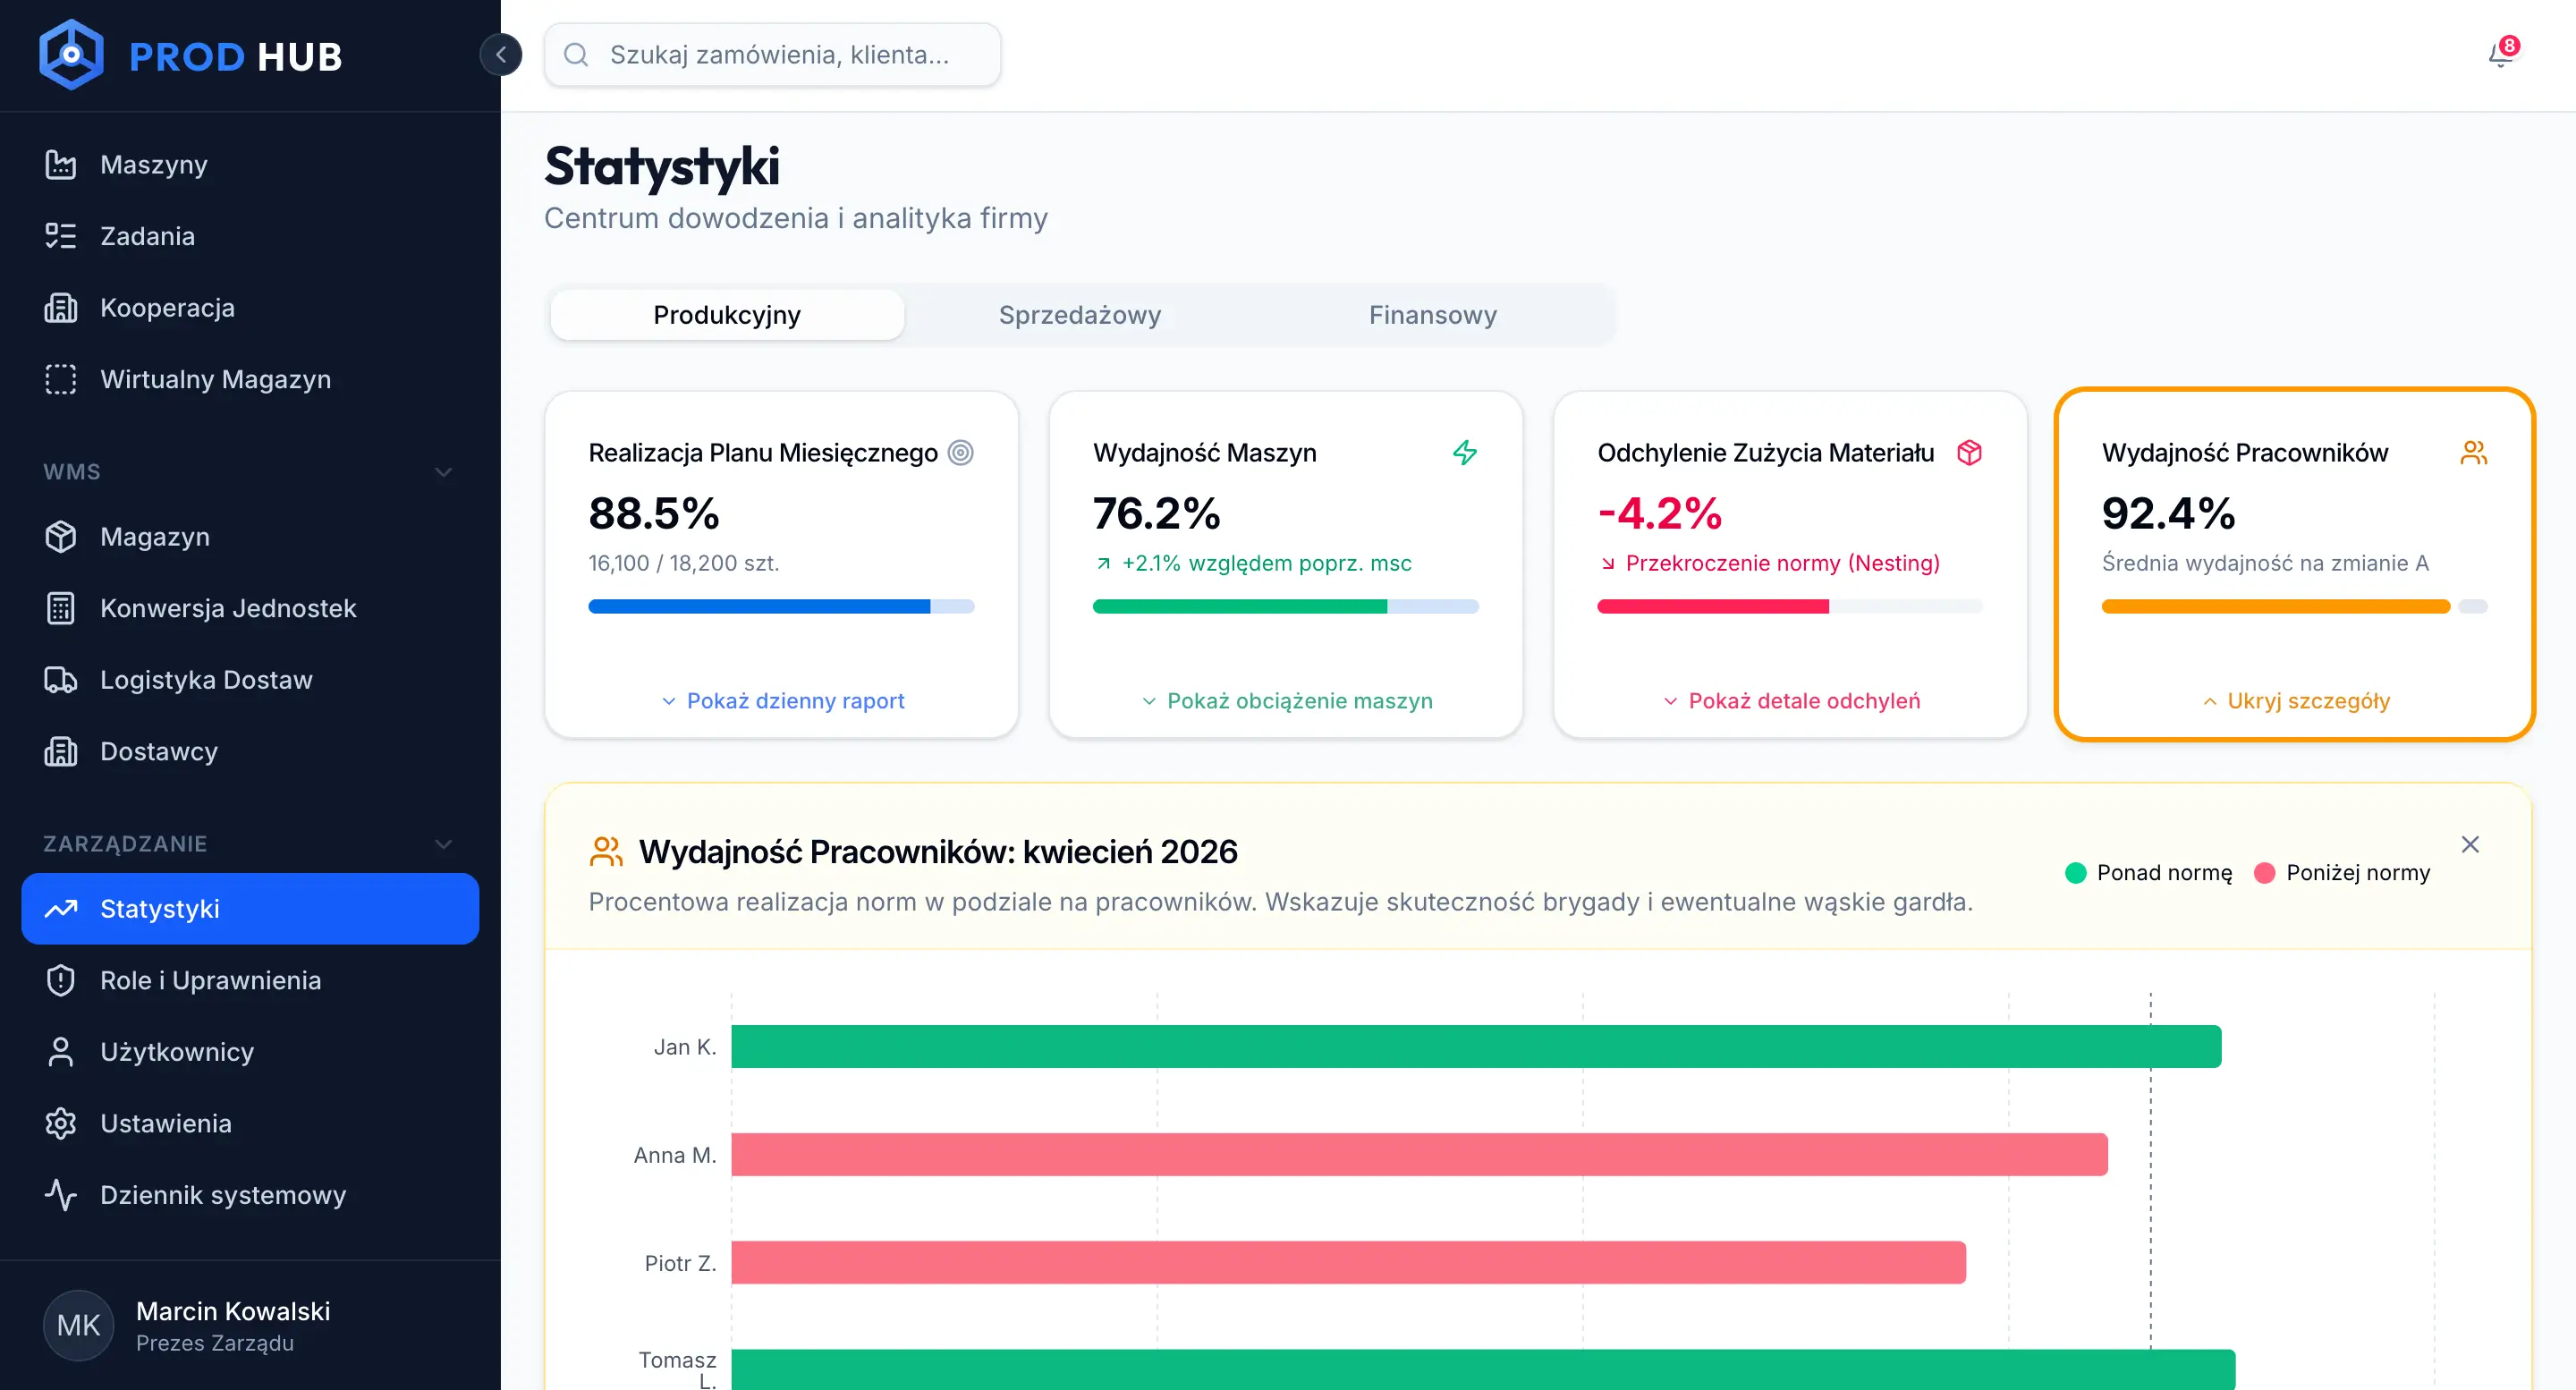
Productivity of employees — production reporting at the level of individual persons (number of units made, shortages, deviations from the norm), which allows to evaluate the efficiency and automatically calculate bonuses. This panel allows you to monitor the progress of production orders.
Quality of production — insight into the number of defective elements along with the causes (e.g. breakdowns, lack of raw materials).
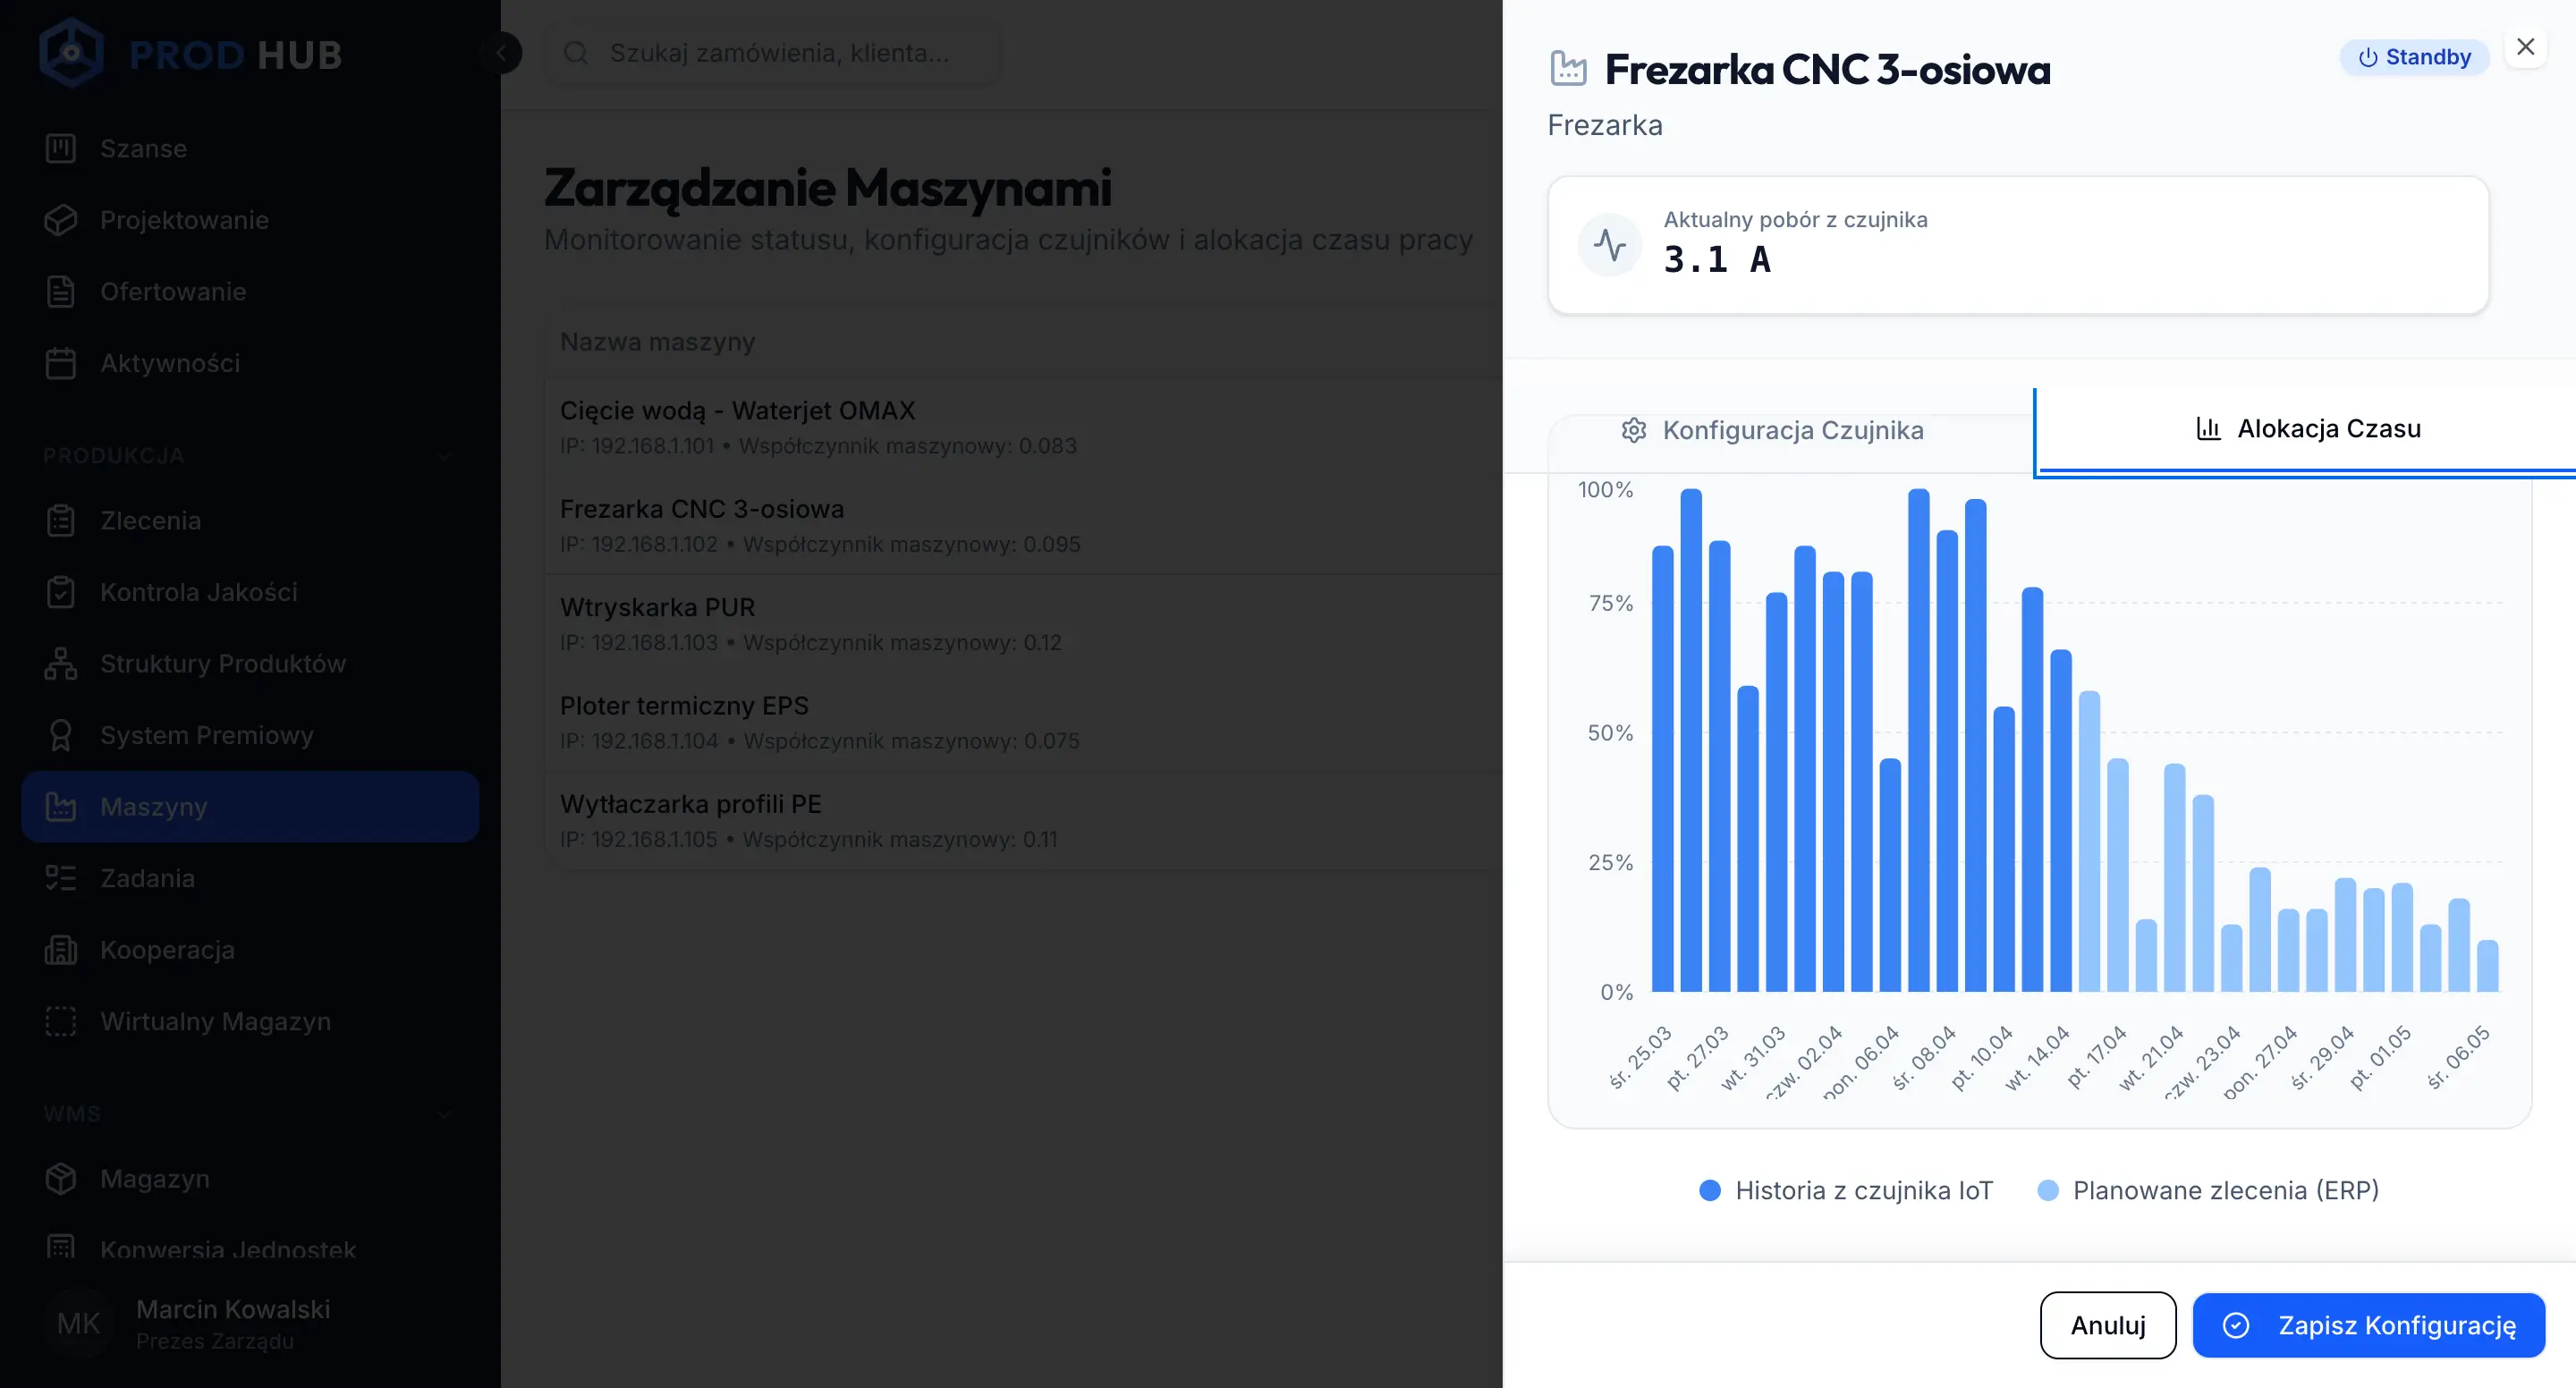
Machine monitoring — automatic analysis of the status of devices based on sensors (e.g. power consumption), allowing to determine whether the machine is working, idle or has failed.
Utilization of resources — analysis of machine occupancy over time (history + planning), which supports production optimization and better project management for customers.
Example of a machine power consumption and operating time report for a manufacturing company
An example of a management report showing performance in a manufacturing company
Thanks to this combination of information from various sources, the management of the company gained full visibility of the production process and the ability to quickly responde to performance drops at the level of the entire organization.
Controlling in the sales department for a company offering B2B services
The company in the B2B services sector faced low sales efficiency and lack of transparency in the distribution of leads among teams. The process of assigning queries was manual and time-consuming, which affected both the results and the motivation of the traders.
The management of the company wanted to reduce the lead time, since the main strategic goal of the company was to gain a competitive advantage.
After a preliminary examination of the processes, we implemented a system of automatic distribution of leads and simplified the integration structure. The most important change, however, was CRM system extension with reporting module and management dashboards that aggregate key data.
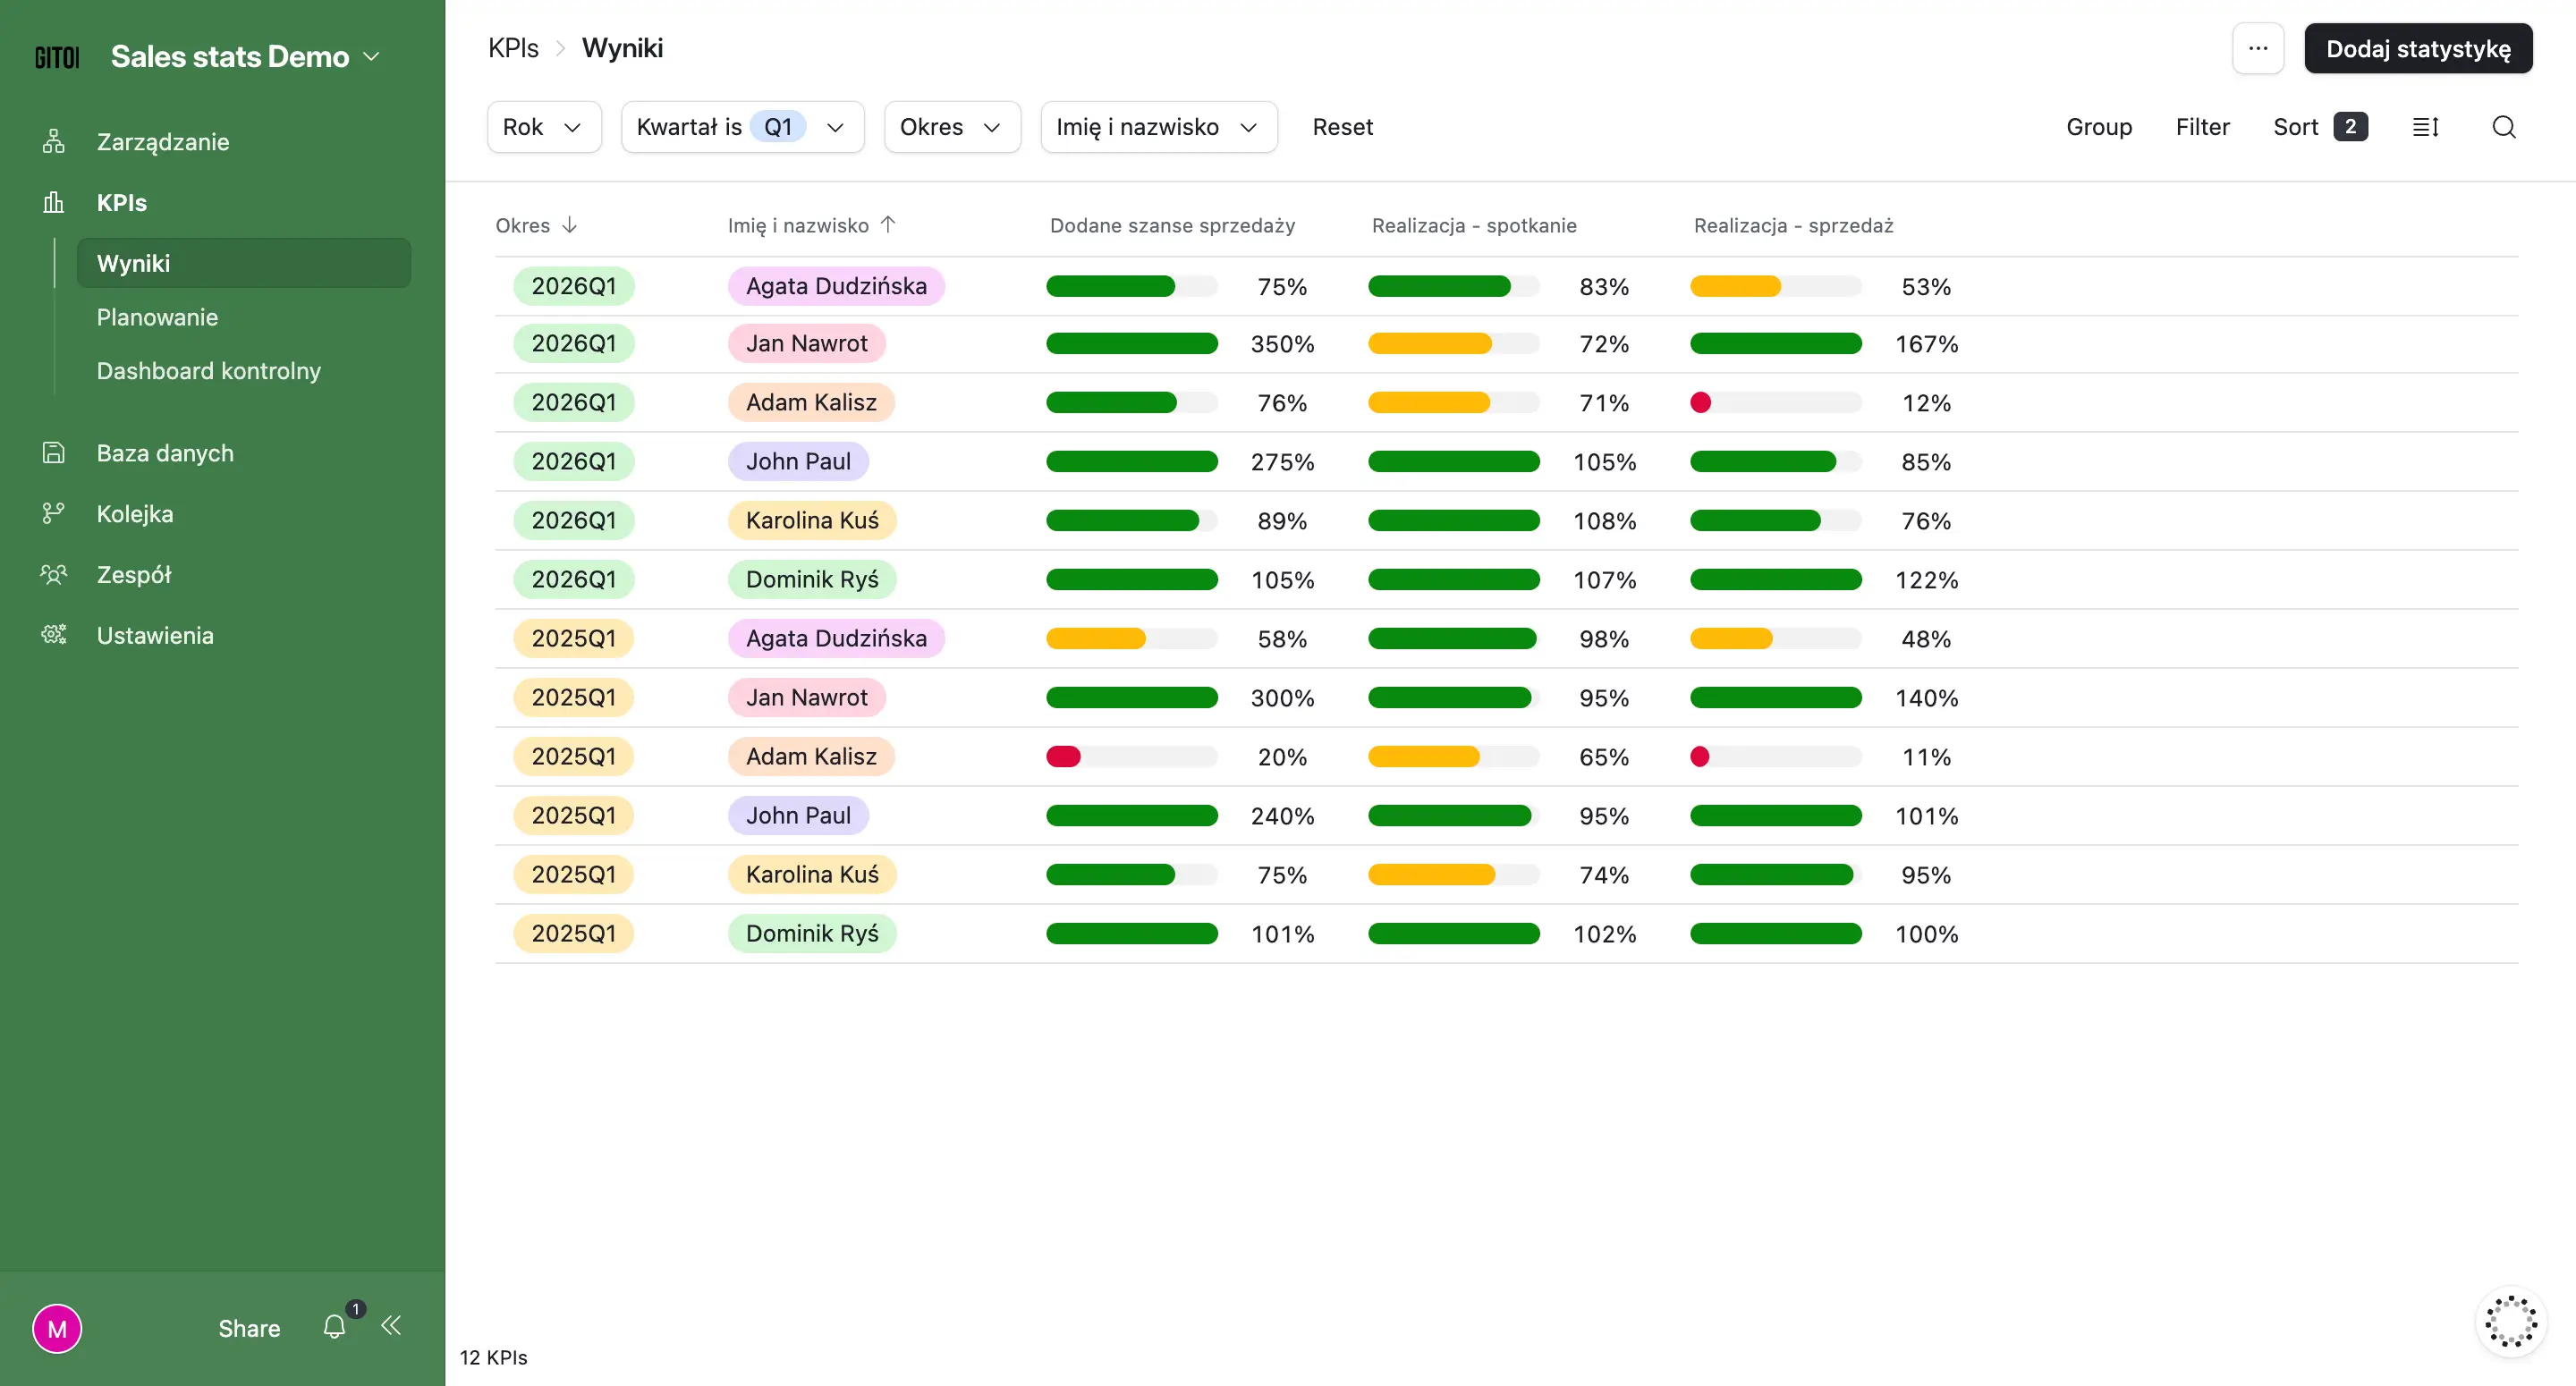
We created an analysis and reporting module in the Airtable tool, which included different views tailored to the user's role, it allows you to:
monitoring conversions and sales value,
analysis of the effectiveness of sales activities,
comparing the results of traders and teams,
views for employees showing the degree of achievement of objectives (e.g. percentage of the standard produced),
more detailed dashboards for managers with key KPIs,
gamification elements for employees, e.g. presentation of results in real time on screens in the office.
Example of reporting results in Airtable aimed at better implementation of the company's strategy in the sales area
Thanks to dedicated sales dashboards, everyone in our client's company has access to information tailored to their needs — employees see progress of goals, and managers can analyze performance and make decisions on an ongoing basis.
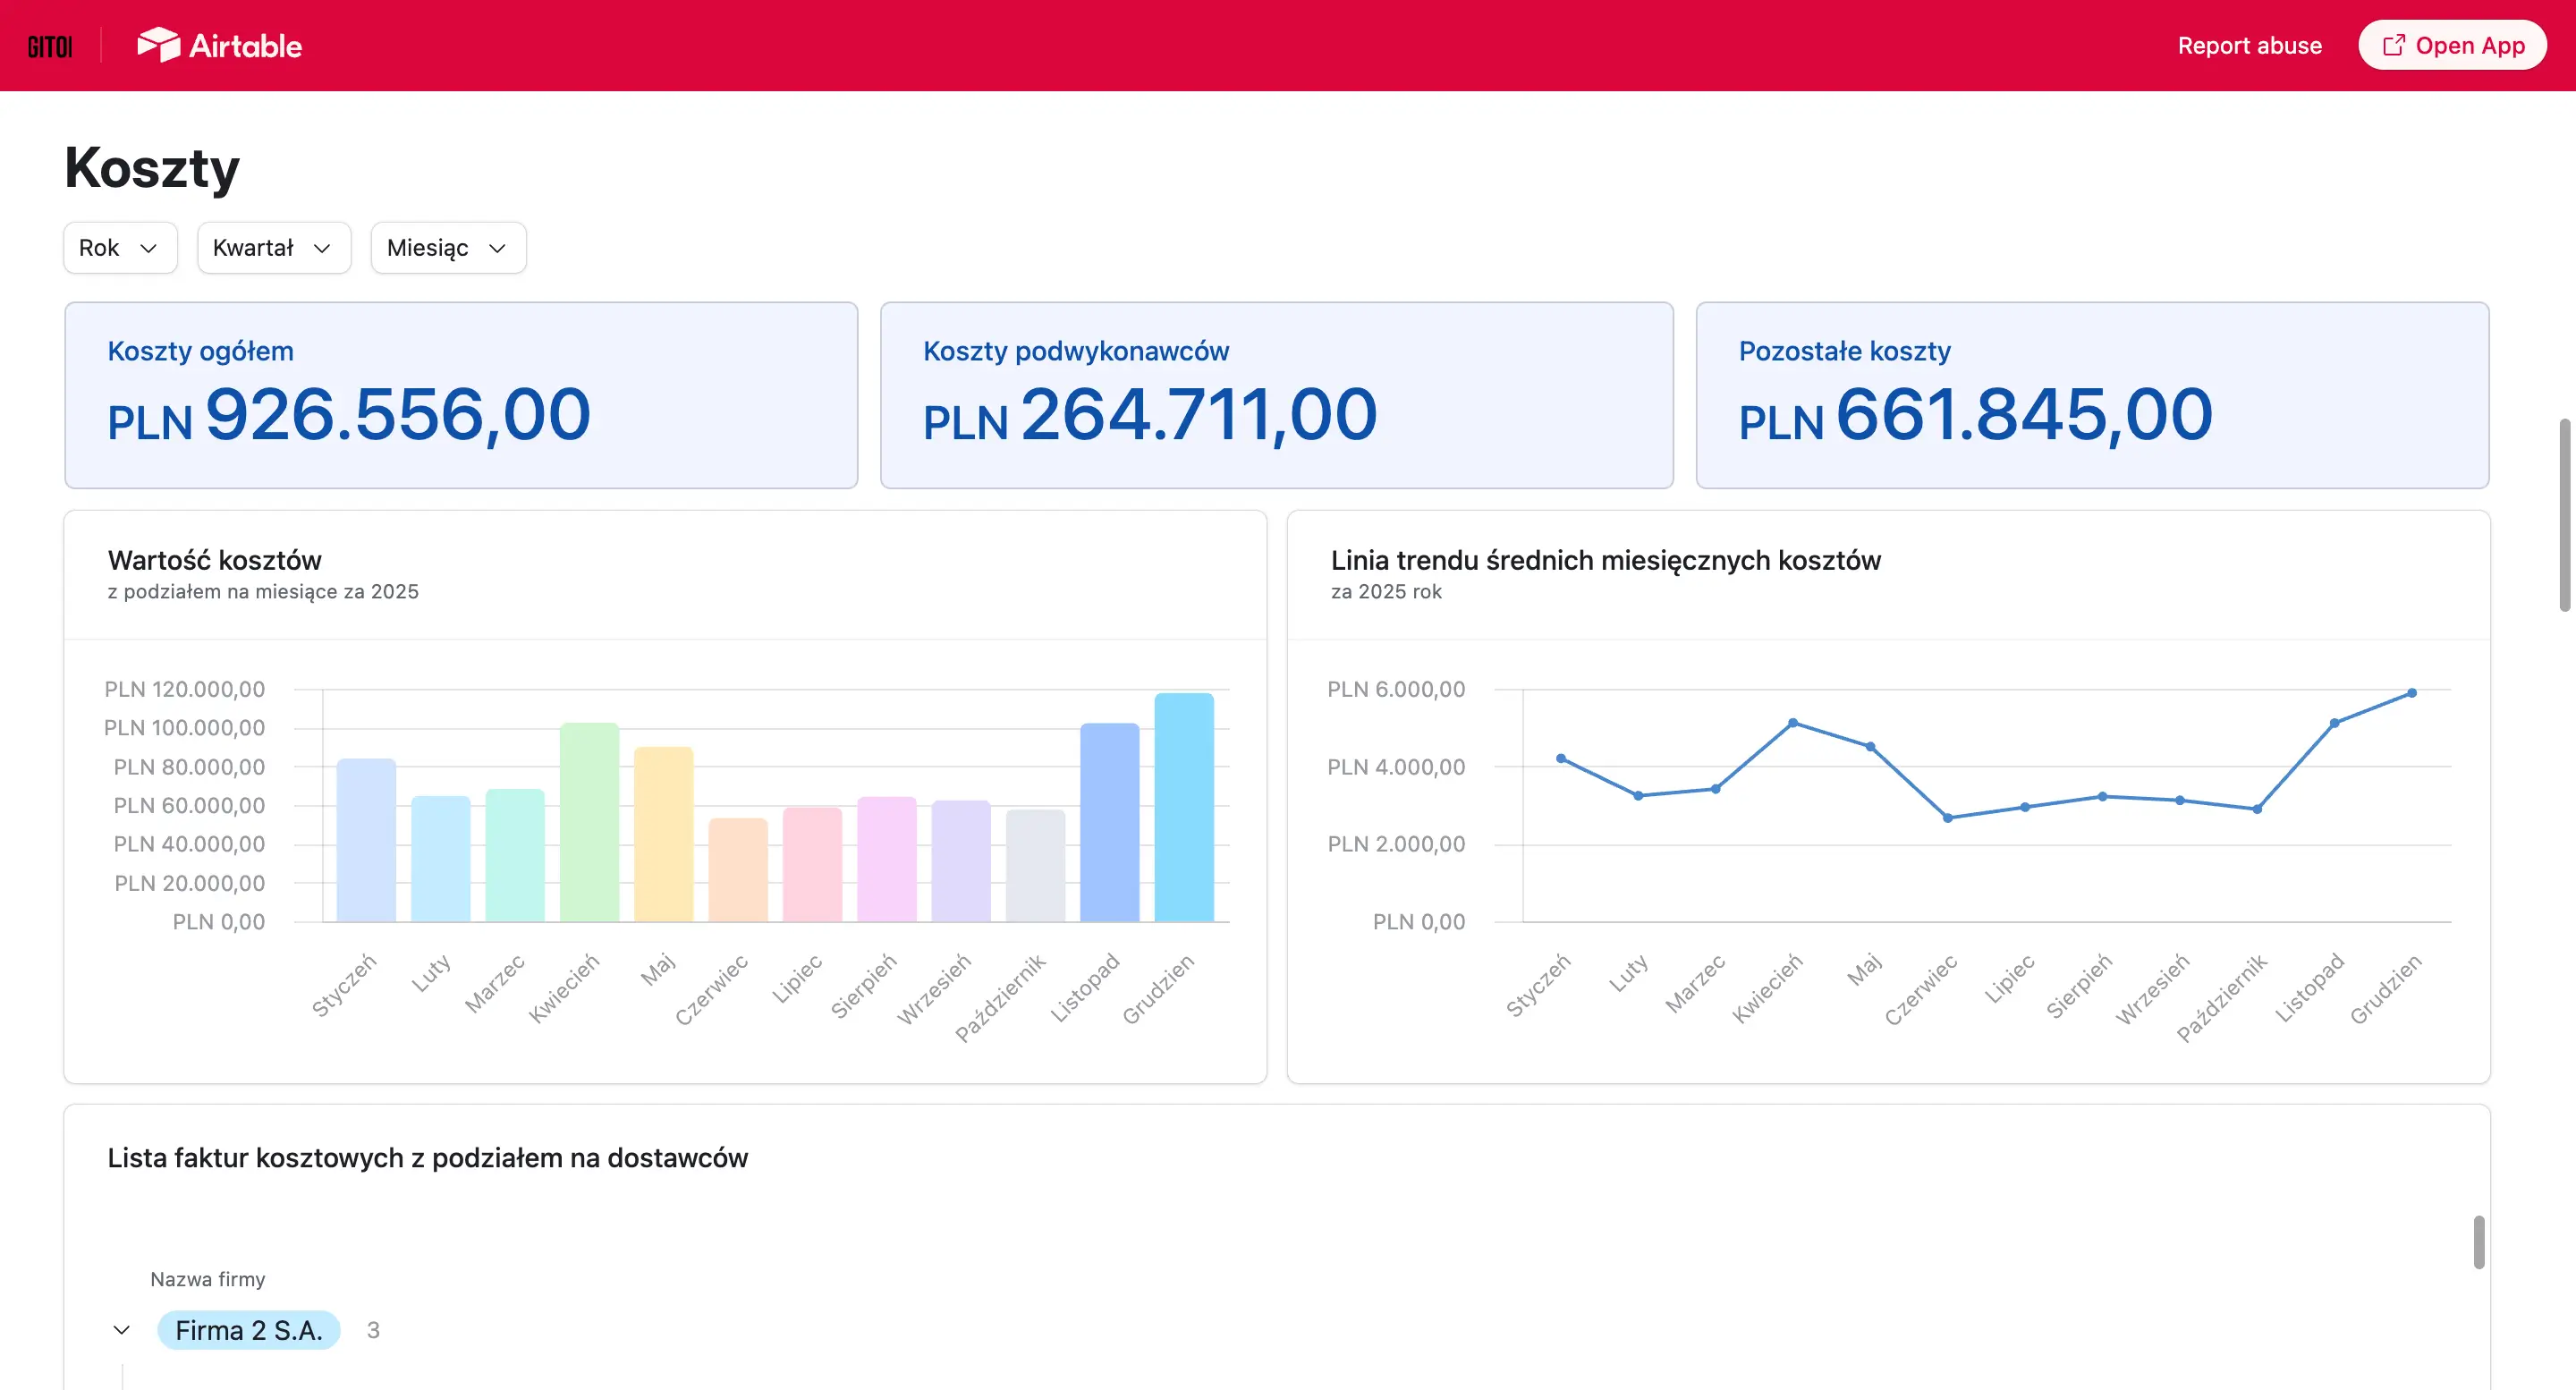
Automated financial report for a client managing four companies
A client managing several companies collected information each week from four finance departments, using different tools. The process was time-consuming, error-prone, and caused delays in financial analysis.
We created the integration of systems with a central information base, which made it possible to automatically import and aggregate financial data in one place. The information is updated regularly, without the need to manually submit reports.
A very important part of the project were automatic notifications and alerts. The system monitors key indicators and, in case of exceeding the established thresholds, immediately informs the client (e.g. by e-mail or by instant messenger).
It is in this project that you can see one of the biggest differences between manual and automated reporting:
the user does not have to check the data himself - the system informs him about deviations,
the risk of missing significant changes (e.g. in budget or costs) is minimised,
automatic analysis of the links between data from different sources is possible, which gives a more complete context for decision-making.
As a result, the client can react to changesimmediately, and not just during the periodic analysis of reports.
Summing up, when to implement automated controlling tools
Automated management reports are worth implementing, first of all, if in your company:
information is still aggregated manually,
managers have to wait for the preparation of reports or do not wait and make a decision without having reliable information,
you learn about deviations in indicators with a delay (or not at all),
lack of transparency in important areas (e.g. you don't know how much budget a particular department is spending),
interpretation of the state of the company is difficult or impossible without time-consuming work.
Automated management reporting is not only an improvement in current work, but above all a solid basis for further automation of processes and the implementation of real improvements in the organization — always tailored to the needs of the company.
Thanks to modern no/low-code tools such as Airtable or Baserow, or using appropriate libraries (e.g. Recharts), implementation does not have to be expensive or time-consuming. In the case simple reports the solutions can be introduced from around EUR 1500 while cooperating with an automation agency, and their effect on an annual basis often translates into very concrete savings and better business decisions.
Contact us and evaluate the implementation of your own management reports tailored to the needs of your company.
Join our newsletter
Subscribe and receive additional content, checklists and business automation tips from us.
Thank you for subscribing to our newsletter!
You will soon receive a welcome message at the email address you provided.
Oops! Something went wrong, failed to send the form.
Book a free consultation with our specialist
At Sagiton Automation, we help companies squeeze more out of aggregated data. Contact us, make an appointment with our specialist and take a step towards better management reporting in the company.
6 Ways to Use Artificial Intelligence in Your Business
Find out in which areas of business the use of artificial intelligence is most cost-effective and what the biggest benefits of AI are for businesses.
Read more
Business automation
06.07.2026
automation-of-document-flow
Automation of electronic document flow in the company
Long contract processing, constant delays in signing orders or communication chaos in the administration department? Read our article and learn how implementing document flow automation in your company can improve your business processes!
Read more
Business automation
06.07.2026
where-to-start-automation-of-business-processes
Business Process Automation in your Company — where to start?
Business process automation is a topic that is gaining importance among entrepreneurs who want to increase work efficiency. Read the article and learn how business process automation can help your team with everyday tasks.
Read more
Napisz do nas!
Wybierz w formularzu temat, który Cię interesuje, a nasz specjalista skontaktuje się z Tobą w przeciągu 24 h roboczych.
Thank you for contacting us!
Your message has been successfully sent. We will reply as soon as possible.
Oops! Something went wrong, failed to send the form.


.webp)

-p-1600.webp)

