Business automation
06.07.2026
sales-reporting
Sales reporting — how to reduce the time to create reports?
Read our article to learn how to implement effective sales reports that your team won't have to spend tens of hours a month on preparing.


Modern business dashboards allow not only a clear visualization of business data, but above all they really help entrepreneurs in running their companies. Read the article and learn about the 5 most important abenefits of implementing business intelligence.

Business intelligence dashboards are interactive dashboards and charts that present data from different sources in one place — such as CRM, accounting systems, marketing or HR tools. Their task is to continuously monitor key indicators of the company's health through a clear visualization of data, e.g. in the form of tables, KPIs or a single graphs.
The use of such solutions allows continuous analysis of data in real time because thanks to integrations with other platforms, all information is transmitted on an ongoing basis. In this way, dashboards allow you to review the data without having to manually go through various tools and prepare statements.
Well-designed dashboards are much more than aesthetic visualization. It's the foundation of effective data-driven business that improves efficiency, saves time and accelerate business outcomes. Below we present the most important benefits of implementing business intelligence in an organization.
One of the key advantages of BI dashboards is the full integration of information. Everything that appears on other systems is automatically transferred to the dashboard — without manual copying, without the risk of mistakes and without omitting any source. Such automation of reporting eliminates human error and allows you to work on consistent data.
This is of particular importance in the area of finance. Although accounting tools facilitate ongoing monitoring, combining financial data with sales or marketing information can be problematic. Many companies still create a separate report for each department, which makes it difficult to carry out a comprehensive analysis.
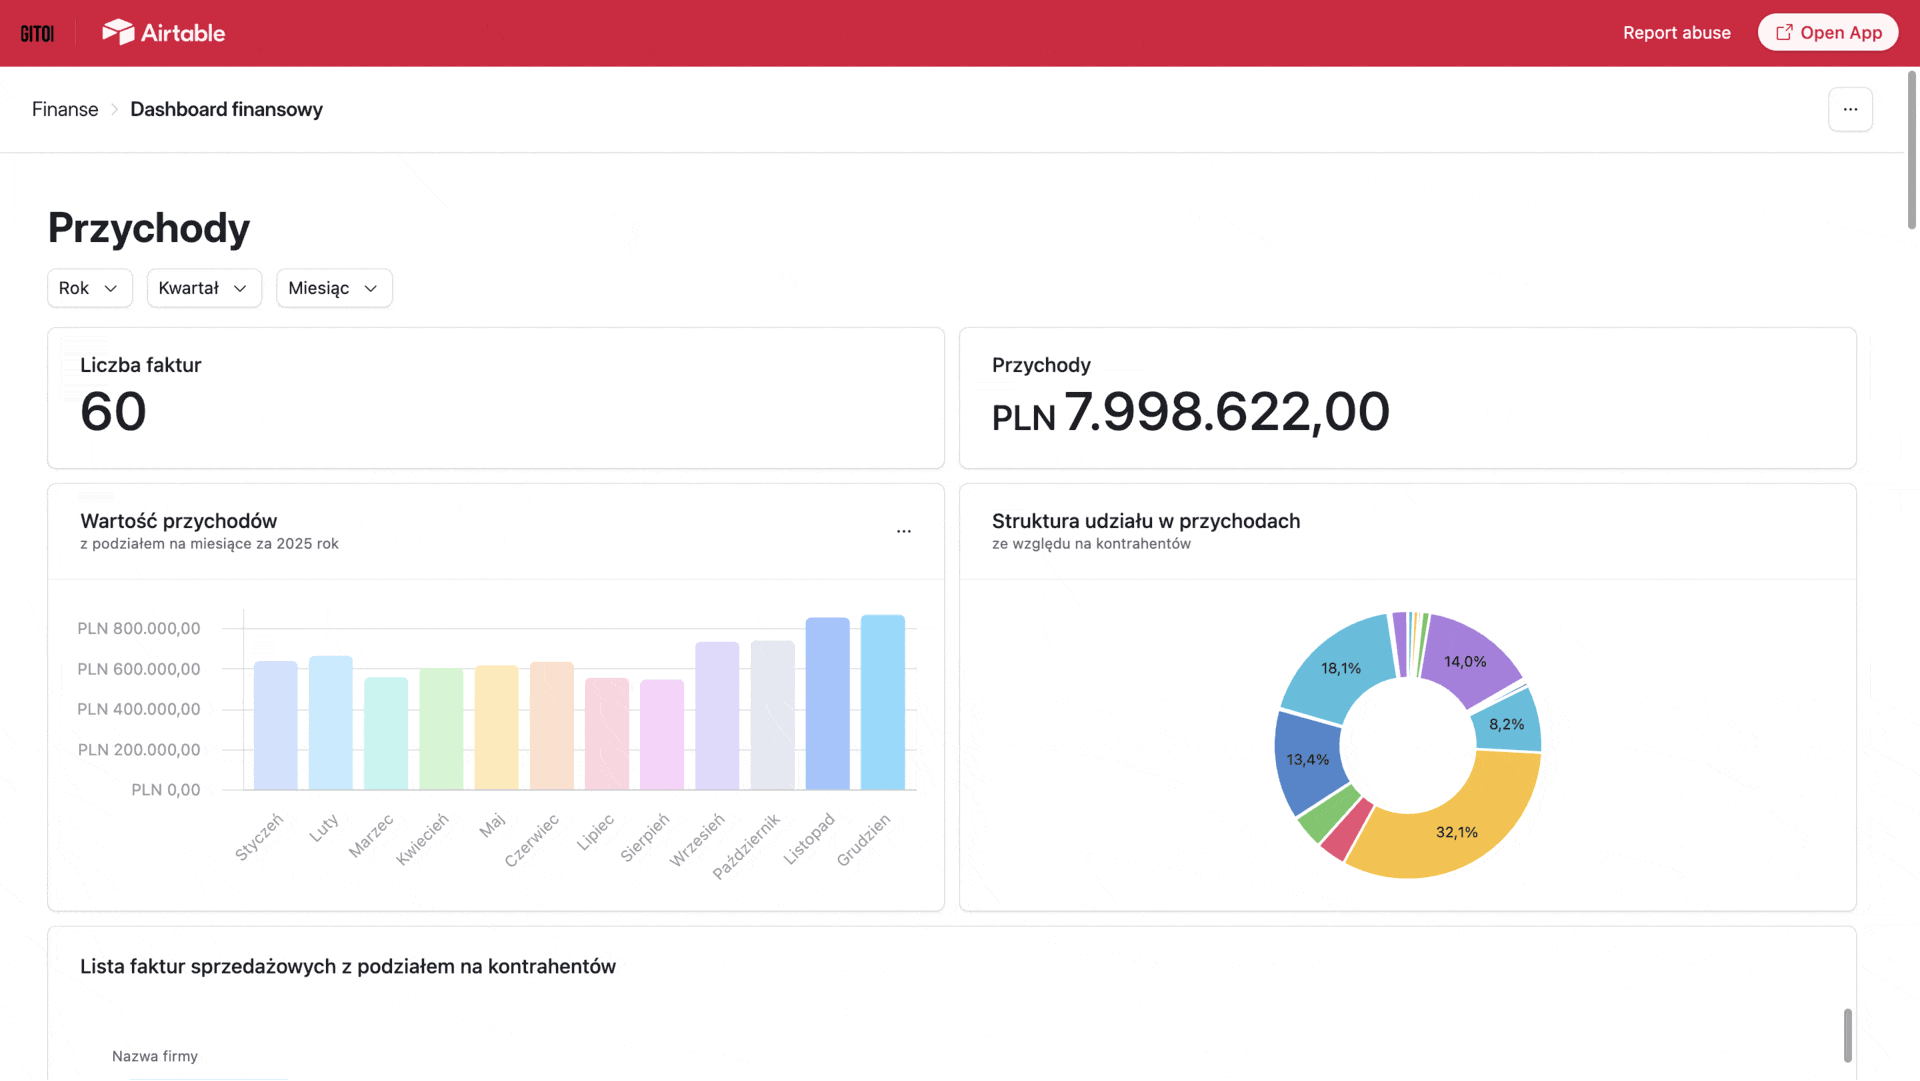
Such a problem also existed with our client, who had to manually pull data from four different financial programs. Thus, the process of creating a report required the involvement of several departments that worked on different accounting systems and manually combined statements. Data analysis was time-consuming, error-prone, and performed only once a week, which made it impossible to react quickly to deviations. After implementing business intelligence, we integrated all sources into a single system and launched full automation of reporting. The data began to update in real time, and the lack of manual work eliminated errors. In addition, we have created alerts that inform managers when key financial thresholds have been exceeded. This automation of business processes not only improved the entire process, but above all saved our client's company about 300 hours per month — this is the time that employees spent on managing the company's finances before the new financial dashboard was created. Due to how time-consuming the process was, our project achieved a total return on investment within 10 months of commissioning.
In companies, there are many decisions that we make thanks to mystical “intuition”. Often running a business it seems to us, that we know our company well, but a lot of things we just don't know:
And then it turns out that:
With business data visualization and clear KPIs, we can analyze facts, not guesswork, which directly supports decision-making at every level of the organization.
Get a handle on the chaos in your data by implementing business intelligence dashboards! Schedule a free consultation with our specialist and get a demo of your dashboard.
Free consultationEven if the company owns the data and regularly creates reports, without their centralization it is difficult to see the full picture of the situation. Information scattered across sheets, folders, and systems requires additional data aggregation work.
BI dashboards solve this problem. They automatically aggregate data in one place and enable quick analysis by filtering periods, teams or products. Since the automation of reporting works continuously, at the time of the crucial decision, most of the work is already done. No need to “collect” the data — just a few clicks in the dashboard to check trends or performance indicators.
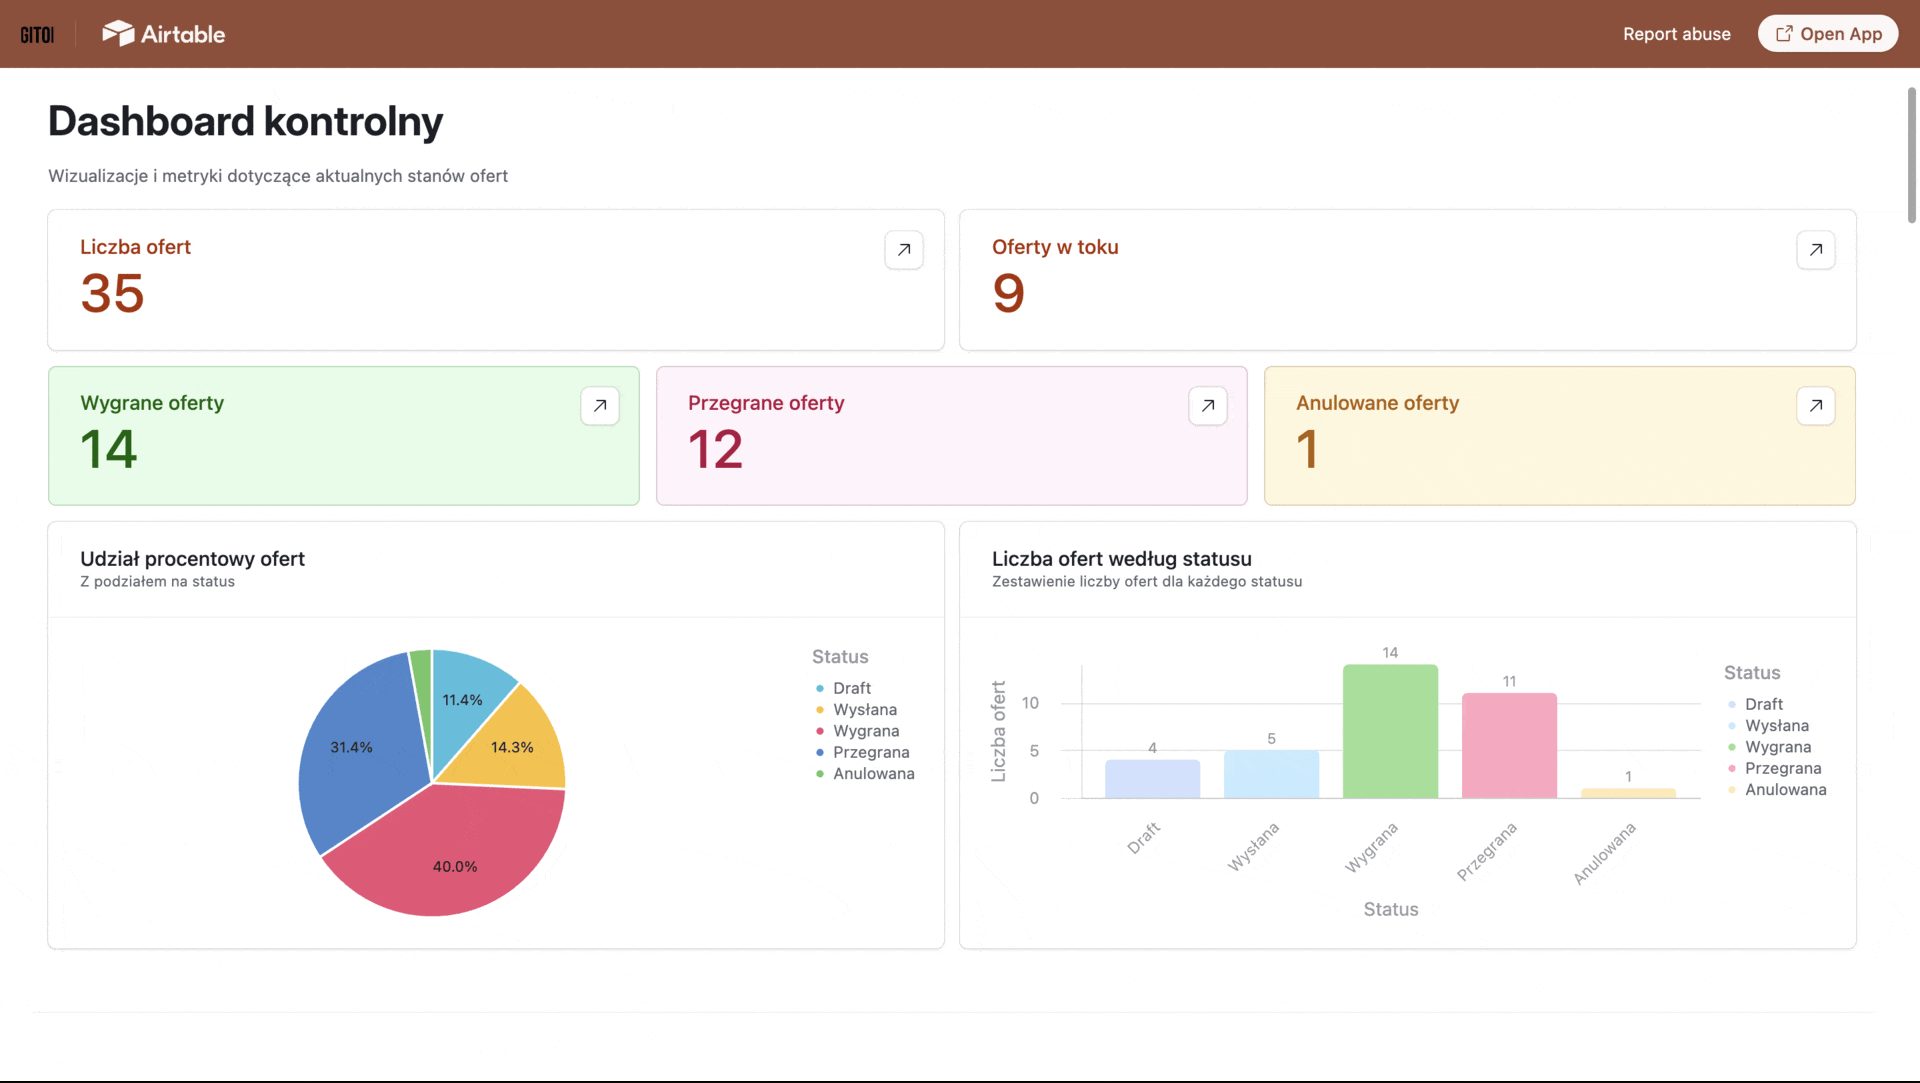
A good example of a solution that helps companies make better business decisions is the sales dashboard, which shows which trader closes the most deals. Thanks to this, when an important customer or tender appears, the company immediately knows who to assign the lead to in order to maximize the chance of success.
Business intelligence dashboards are not only visualization, but also a real time saver. In organizations with hierarchies and functioning reporting processes — such as when salespeople report to managers — automating reporting with dashboards keeps data always up to date and accessible without involving employees.
For example, in the marketing department, an interactive dashboard integrates data from Google Ads, Meta Ads or LinkedIn. The manager does not have to log in to each tool separately to track campaigns — he sees everything in a single dashboard. On the other hand, in companies that still send PDF reports (e.g. to headquarters or managers), BI dashboards allow quick data export. The employee selects the scope, structure and in a few seconds generates a ready-made report, which significantly increases the efficiency of work.
A single source of truth improves communication not only on the employee-manager line, but also between teams. Sales and marketing dashboards organize information chaos and support common business goals.
With access to information from the sales department, marketing can optimize campaigns based on real results. The team sees which leads convert, where it is worth moving the budget, and which activities bring the most revenue. It doesn't have to constantly ask sales for lead status, which improves collaboration, reduces response time, and supports overall management.
As you can see, BI dashboards are one of the most crucial tools to support the development of companies today. The right implementation of business intelligence allows not only to better analyze data, but also to increase the efficiency, quality of decisions and scalability of the organization.

If you want to see how dashboards can help you optimize processes in your company, a professional consultation and a well-planned BI implementation is the first step towards data-driven conscious management. Contact us and arrange a free online consultation with our specialist who will know the needs of your business and answer any business questions.
Free consultation.webp)
Business automation
06.07.2026
sales-reporting
Sales reporting — how to reduce the time to create reports?
Read our article to learn how to implement effective sales reports that your team won't have to spend tens of hours a month on preparing.
-p-1600.webp)
Business automation
06.07.2026
where-to-start-automation-of-business-processes
Business Process Automation in your Company — where to start?
Business process automation is a topic that is gaining importance among entrepreneurs who want to increase work efficiency. Read the article and learn how business process automation can help your team with everyday tasks.

Business automation
06.07.2026
how-to-avoid-mistakes-in-process-automation
Mistakes in business process automation and how to avoid them
Business process automation can revolutionize business operations, increase efficiency and reduce costs. However, ignorance of the most common mistakes in this process can lead to their repetition, which carries the risk of costly failures.
Wybierz w formularzu temat, który Cię interesuje, a nasz specjalista skontaktuje się z Tobą w przeciągu 24 h roboczych.
Thank you for contacting us!

