Manual sales reporting blocks department efficiency
Imagine that you are a sales manager in a dynamically developing company. Every day you have to make business decisions Based on detailed data analysis: how to allocate budget, which products to promote, how to optimize operational processes or when to increase team resources. Meanwhile, the statistics on which you base your decisions are scattered, outdated or full of errors.
Collecting this information manually consumes hours, generates confusion and delays action, which in the case of sales processes not only takes up the time of traders unnecessarily, but above all inhibits the flow of leads into the funnel.
Fortunately, the time for creating reports in the sales department can be reduced. We will tell you how to do this step by step in the next paragraphs. And if you are an e-commerce owner and looking for online sales management solutions, check out our article on the subject: https://www.sagiton.pl/en/blog/automations-for-ecommerce-management
How to shorten and streamline the process of creating a sales report
Manual reporting of sales results is the optimal solution if you run a small business, the only salesperson is you or your partner, and sales are limited to a few conversations per week. However, if there are several dozen or even several hundred potential customers in your sales funnel, collecting all the information manually could be quite problematic.
Therefore, the process of reporting sales results it is worth shortening with integration and automated data flows. Below you will find 5 steps (and an additional 6.) for efficient management of sales data in the enterprise.
Do you want to improve the creation of sales reports? Contact us — we help companies aggregate and use data better.
A CRM system is a basic tool that allows you not only to track any activities of the sales team, but also to forecast results. Many CRMs also have modules with sales reports, but they often lack flexibility:
No custom reports — the form of dashboards for data presentation is imposed from above and cannot be changed.
Data from only one source — the sales report shows only the information aggregated in the CRM system itself and there is no possibility of integration with other sales or marketing tools.
On the other hand, these difficulties can be easily circumvented by combining different systems. If salespeople in your company do not yet use a CRM system, because, for example, they write down information and tasks on a sheet of paper, it is worth taking this first step towards digitization of sales.
2. Establishment of key indicators to monitor
Does more data mean better sales results? Not necessarily. Too much information often leads to chaos — the more indicators, the more difficult it is to find them and the more time it takes to analyze the report. As a result, instead of speeding up decision-making, reporting begins to slow it down.
Therefore, it is worth focus on a few key KPIs, that really support sales management — for example, the number of leads, conversion rate or sales value. They should be chosen to answer specific business questions, and not just “collect data”.
The second important aspect is the perspective of the team. If overnight traders learn that they have to track and analyze many new indicators, it is very easy to lose motivation and engagement. In the course of our business process audits we pay attention to such risks and communicate them clearly — too much change introduced at once often provokes resistance from employees.
Therefore, the best approach is to implement reporting gradually — starting with 2-3 of the most important indicators, and only later expanding their scope.
3. Integrate CRM data with other tools
In a well-configured CRM system, you will find a lot of valuable information — such as sales activities (e.g. emails sent thanks to inbox integration), opportunity statuses or manually completed data, such as expected revenue or customer size.
However, this is only part of the picture.
There is a lot of data that marketers are not able to fill in on their own — for example, marketing results that have a direct impact on the number and quality of leads. Without them, it is difficult to talk about reliable sales forecasting or evaluating the effectiveness of the company.
Therefore, the next step should be Integrate CRM with other tools used in the organization. Thanks to this, the sales report ceases to be a detached statement of data, and begins to act as a comprehensive source of knowledge.
comparisons of sales data with financial information — thanks to the combination of sales and automation of financial reporting, you see not only the results of the work of the Sales department, but also the real receipts and timeliness of customer payments,
integration with project management systems — which allows better resource planning and identification of overloads in individual departments.
This approach significantly increases the value of sales reports and allows you to make decisions based on the full business context.
4. Implementation of data transfer rules
The integration of systems is just the beginning. In order for the reporting of sales results to be truly effective, it is necessary to define clear rules about how data should flow between tools. The key questions worth answering are:
when the data should be updated (in real time or, for example, once a day)
in what form are they to be sent,
where they should be aggregated and presented.
It is worth remembering that not every CRM system offers advanced integration capabilities — some of them have limited access to APIs or do not allow flexible creation of reports and dashboards.
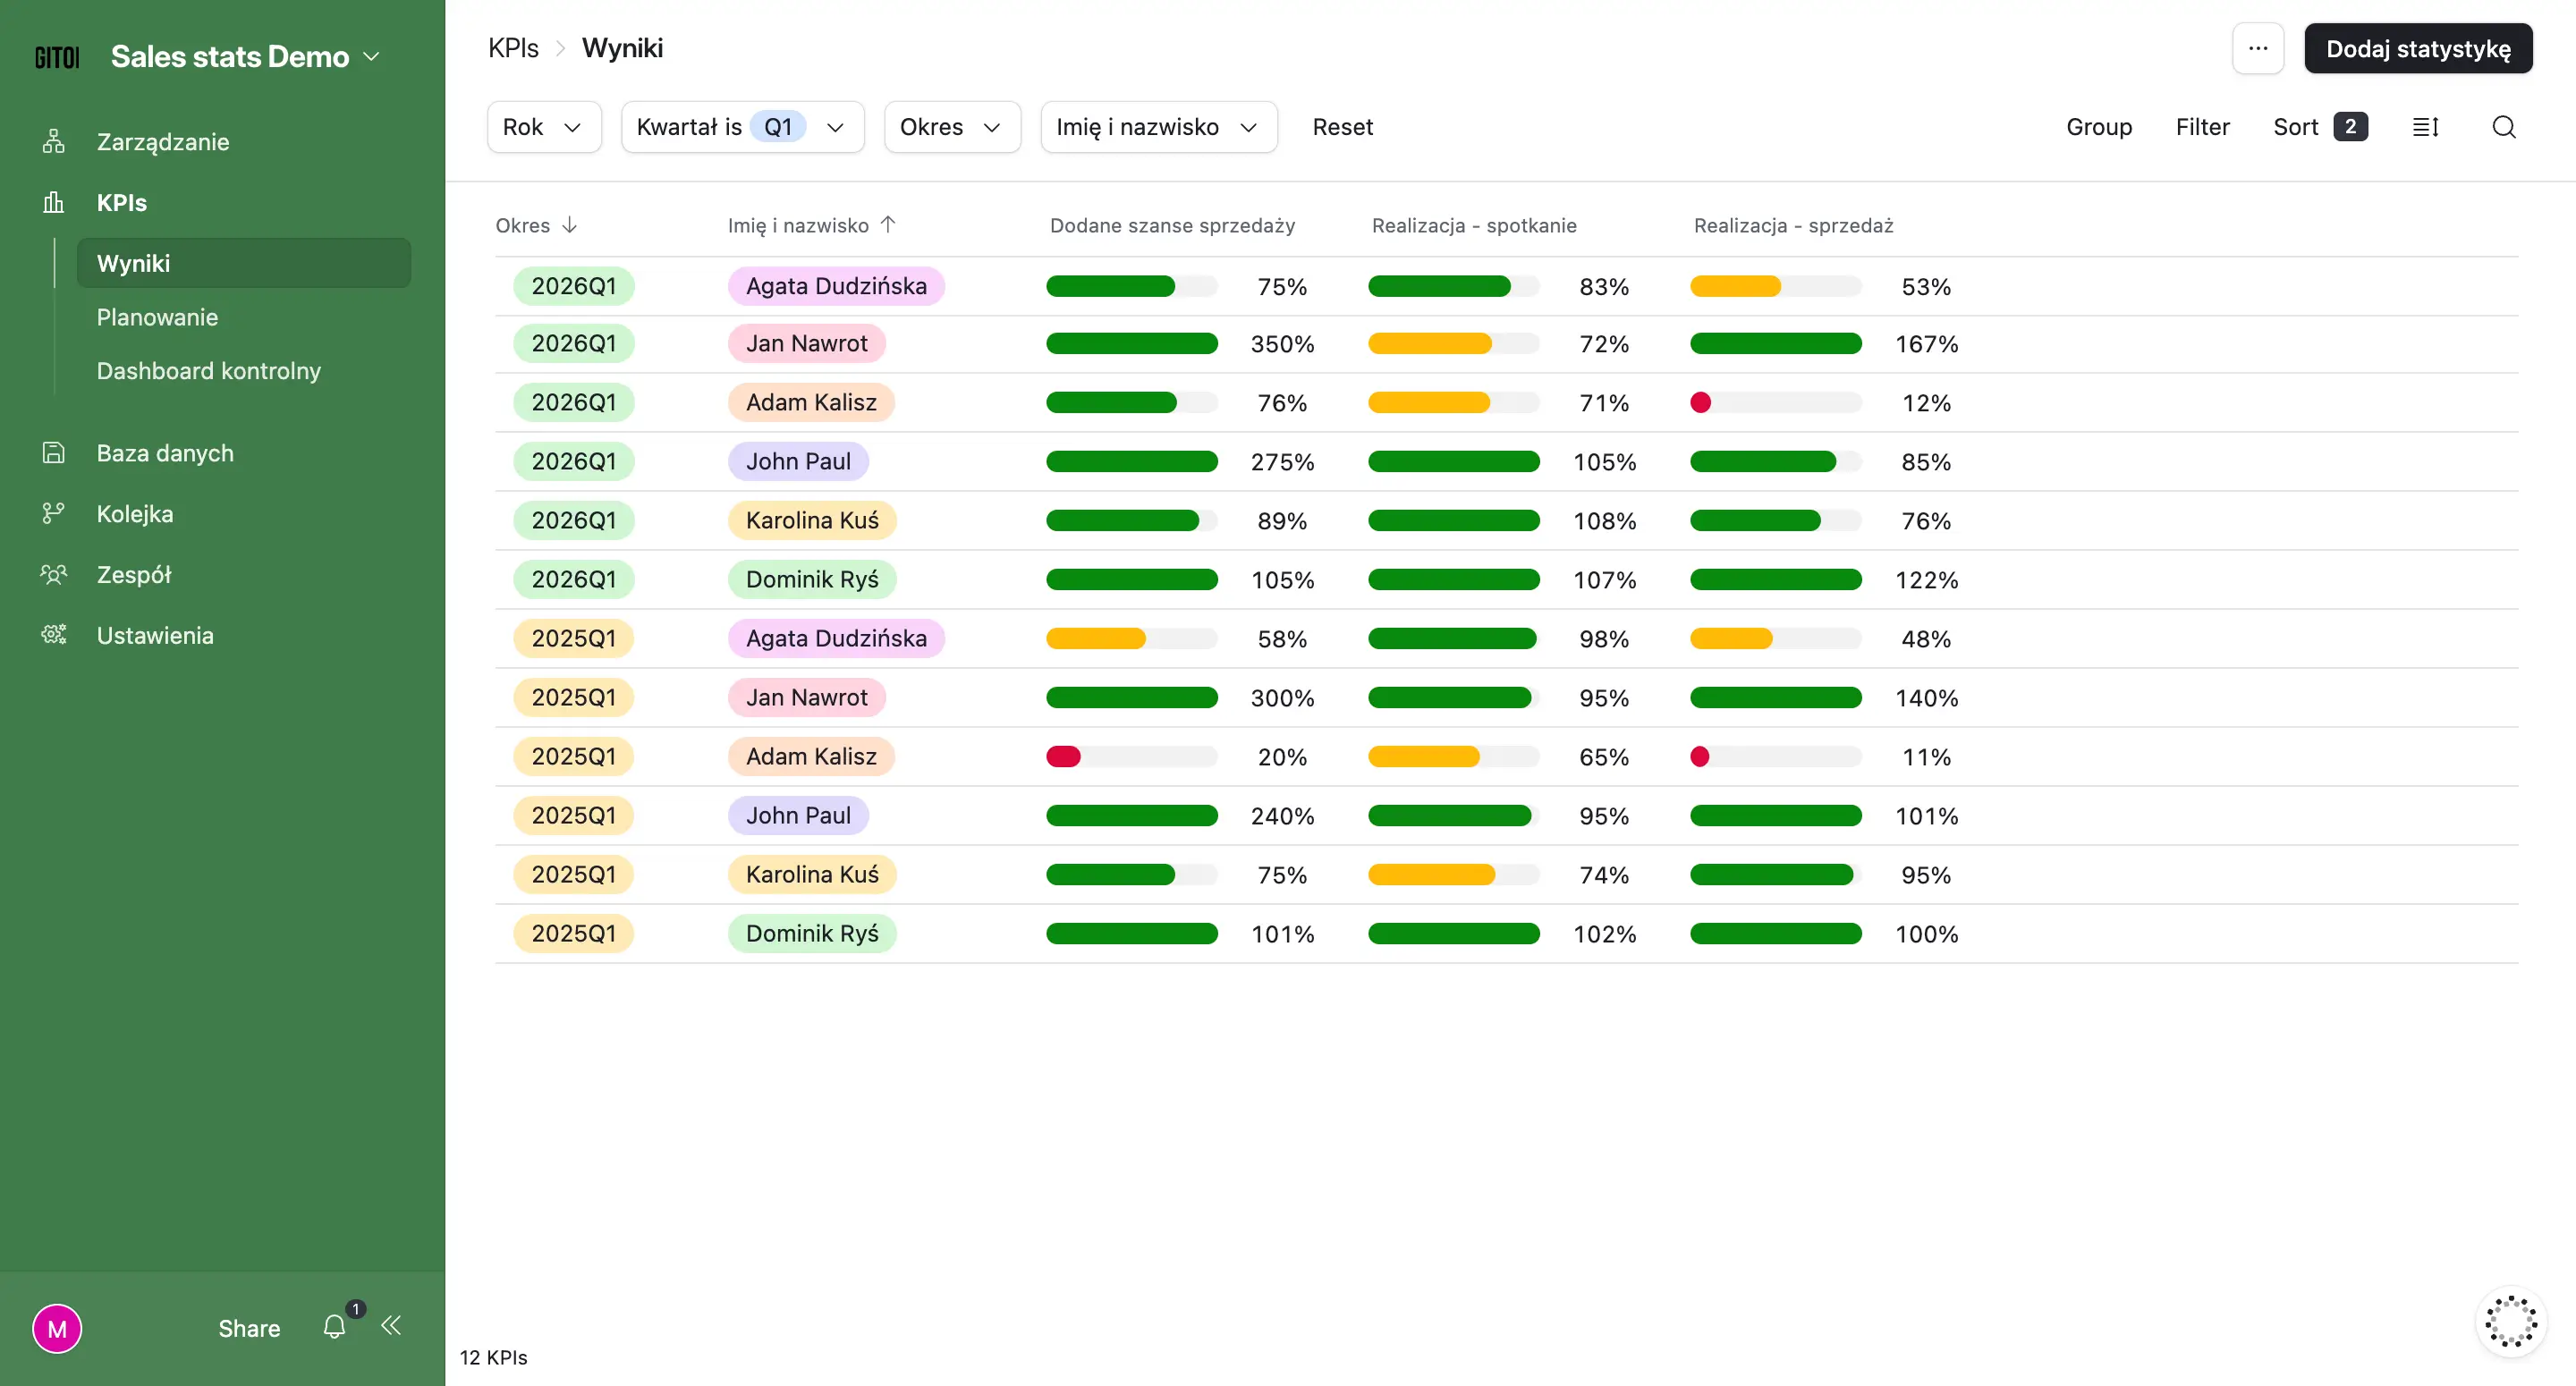
In such cases, a good solution is use of external data aggregation tools. For our clients, we often create dedicated sales reports, e.g. based on Airtable, which combine data from many systems — including CRM — and present them in a transparent, customized form.
Example of a sales efficiency report created by us in Airtable for one of our clients (demo)
As a result, all the key information is in one place, and the team doesn't have to waste time manually collecting and comparing data from different sources.
5. Creation of various types of sales reports in graphic form
A well-prepared sales report is not only a set of data, but above all a readable form of their presentation. Therefore, the next step is to create dashboards that allow you to quickly understand the business situation - without having to analyze dozens of tables and sheets.
It is worth remembering that reports can take many forms — from simple statements to extensive dashboards with the ability to filter and segment data. The key here is the correct “arrangement” of the information: the most important indicators should be in the first view, and more detailed data can be nested and accessible after going deeper. This makes the report clear and detailed at the same time.
The flexibility of the format is also important. In many companies, there is still a need to create reports in PDF format — for example, for specific sales processes or for management. However, a well-designed dashboard can be easily exported to such a form, without the need for manual preparation of documents.
Case study: Sales report combined with marketing data
A good example is our implementation of a marketing and sales dashboard for one of the service companies that was struggling with distributed data and the lack of connection between marketing and sales.
Thanks to the integration of multiple sources and graphical presentation of data in one place, it became possible to monitor campaign performance on an ongoing basis and make decisions based on current data.
Combination of sales and report for the finance department
We use a similar approach in projects such as financial reporting automation — where an interactive dashboard (e.g. in Airtable) allows quick data filtering, automatic calculations and visualization of key indicators.
As a result, managers can easily identify budget deviations and respond to changes in real time. As we wrote in the previous paragraphs, it is worth integrating such a report for the finance department with information about sales opportunities in order to forecast the distribution of transactions and revenues for the coming months, based on data from the sales department.
6. Implementation of additional automation and notifications
The last step that allows you to take sales reporting to the next level is the implementation of automatic data flows. Although a lot of information goes into reports thanks to integrations between systems, in practice there is often a need to build more advanced mechanisms for obtaining and processing it.
For more detailed sales analysis in your company, you can implement automated sales call transcripts among other things. Thanks to this solution, it is possible to document, for example, the quality of customer service. Based on the content of conversations, the reporting system can automatically provide:
Indicators to assess the quality of customer service — for example, the ratio of speaking to listening, the number of questions asked, how you responded to objections
The level of customer engagement in conversations — e.g. sentiment, dialogue dynamics, customer activity during the conversation
The most common customer needs and problems — aggregated topics and recurring topics from sales conversations
The most common purchase objections — identifying the barriers that block the purchase decision
Degree of “advancement” and quality of sales opportunities — e.g. presence of decision maker, specific customer declarations, established next steps
Probability of closing sales (forecasts) — based on analysis of the content of conversations, not just statuses in CRM
Differences in the way salespeople conduct conversations — these metrics allow you to compare approaches and identify best practices
Signals of the risk of losing sales — e.g. negative sentiment, lack of engagement, lack of established next steps.
It is also worth implementing notification system based on data. If any of the indicators deviate from the assumptions - for example, sales at the end of the quarter are lower than planned - the system can automatically inform the manager about this. This allows the team to react faster and make the necessary changes.
This approach means that reporting ceases to be just a summary and becomes a real tool supporting everyday business decisions. Find out more about sales automation.
What to do to make data analysis affect results in the sales process
In order for the data analysis to support the management of sales activities in real terms, a phased approach and a well-thought-out implementation strategy are crucial. Instead of implementing all the solutions at once, it's worth starting from the basics — organizing your data, selecting the most important metrics, and creating clear dashboards that show the business situation at every stage of the sales process.
It is equally important that the data is collected automatically — thanks to integrations and workflows, you not only save team time, but also ensure that you are analyzing current and consistent information. It is they that allow you to better understand the factors that influence sales and make more accurate decisions in the context of the development of your business.
You can not forget about notifications either. Even the best prepared reports will not fulfill their role if no one looks at them. Automatic deviation alerts ensure that key information gets to the right people at the right time — and is actually put to use in practice.
If you want implement an automated sales report and make better use of data in your company — don't hesitate to contact us.
Join our newsletter
Subscribe and receive additional content, checklists and business automation tips from us.
Thank you for subscribing to our newsletter!
You will soon receive a welcome message at the email address you provided.
Oops! Something went wrong, failed to send the form.
We help companies automate sales reports and CRMs
As Sagiton Automation, we are engaged in the comprehensive implementation of IT solutions that improve the work of our clients' companies. Contact us and improve the aggregation of sales data in your enterprise!
Business Process Automation in your Company — where to start?
Business process automation is a topic that is gaining importance among entrepreneurs who want to increase work efficiency. Read the article and learn how business process automation can help your team with everyday tasks.
Read more
Sales
06.07.2026
sales-automation-handling-leads-from-your-phone
Sales automation — handling leads from your phone
In the world of sales, response time is important — we know this from our own experience. A potential customer who fills out a contact form expects a response almost immediately. Meanwhile, many salespeople still have to jump between systems, check emails, manually fill in data in the CRM system, and create dozens of listings a day. The effect? Lack of time to contact the customer and lost sales opportunities. Read our article and learn how, with sales automation, allow salespeople to efficiently handle leads from one place. Ps. the automations we describe are created with mobile-first in mind, so they are effective even for teams working in the field or for those salespeople who attend many meetings every day and do not have time to look into the computer.
Read more
No/low-code
06.07.2026
low-cost-business-application-no-code
How to create low-cost business applications — no code development
No-code and low-code technologies have revolutionized the way business applications are built — expensive programming is a thing of the past. Read our article and learn how even small businesses can quickly and cheaply acquire software for both internal and commercial use.
Read more
Napisz do nas!
Wybierz w formularzu temat, który Cię interesuje, a nasz specjalista skontaktuje się z Tobą w przeciągu 24 h roboczych.
Thank you for contacting us!
Your message has been successfully sent. We will reply as soon as possible.
Oops! Something went wrong, failed to send the form.

.webp)

.gif)
.webp)
-p-1600.webp)


