

Automation of reporting and data processing
We create interactive business dashboards and implement reporting automation so that our clients' businesses operate faster and more efficiently. Turn your data into a competitive advantage with us!

We'll help your business sort out the chaos in your data
Is the data in your enterprise still scattered across multiple Excel files or business tools? The dispersion of information leads to errors and delayed decisions. Contact us, automate the data processing process and start making decisions based on up-to-date, consistent information.
We implement reporting automation for various business sectors:

.webp)
See our demo dashboards for data analysis in Airtable
Presentation of sales data in AEC
The dashboard demo shows the effectiveness of sales processes in a construction company.
.webp)
Automated financial report
See how implementing reporting automation helps you organize your financial data.
.webp)
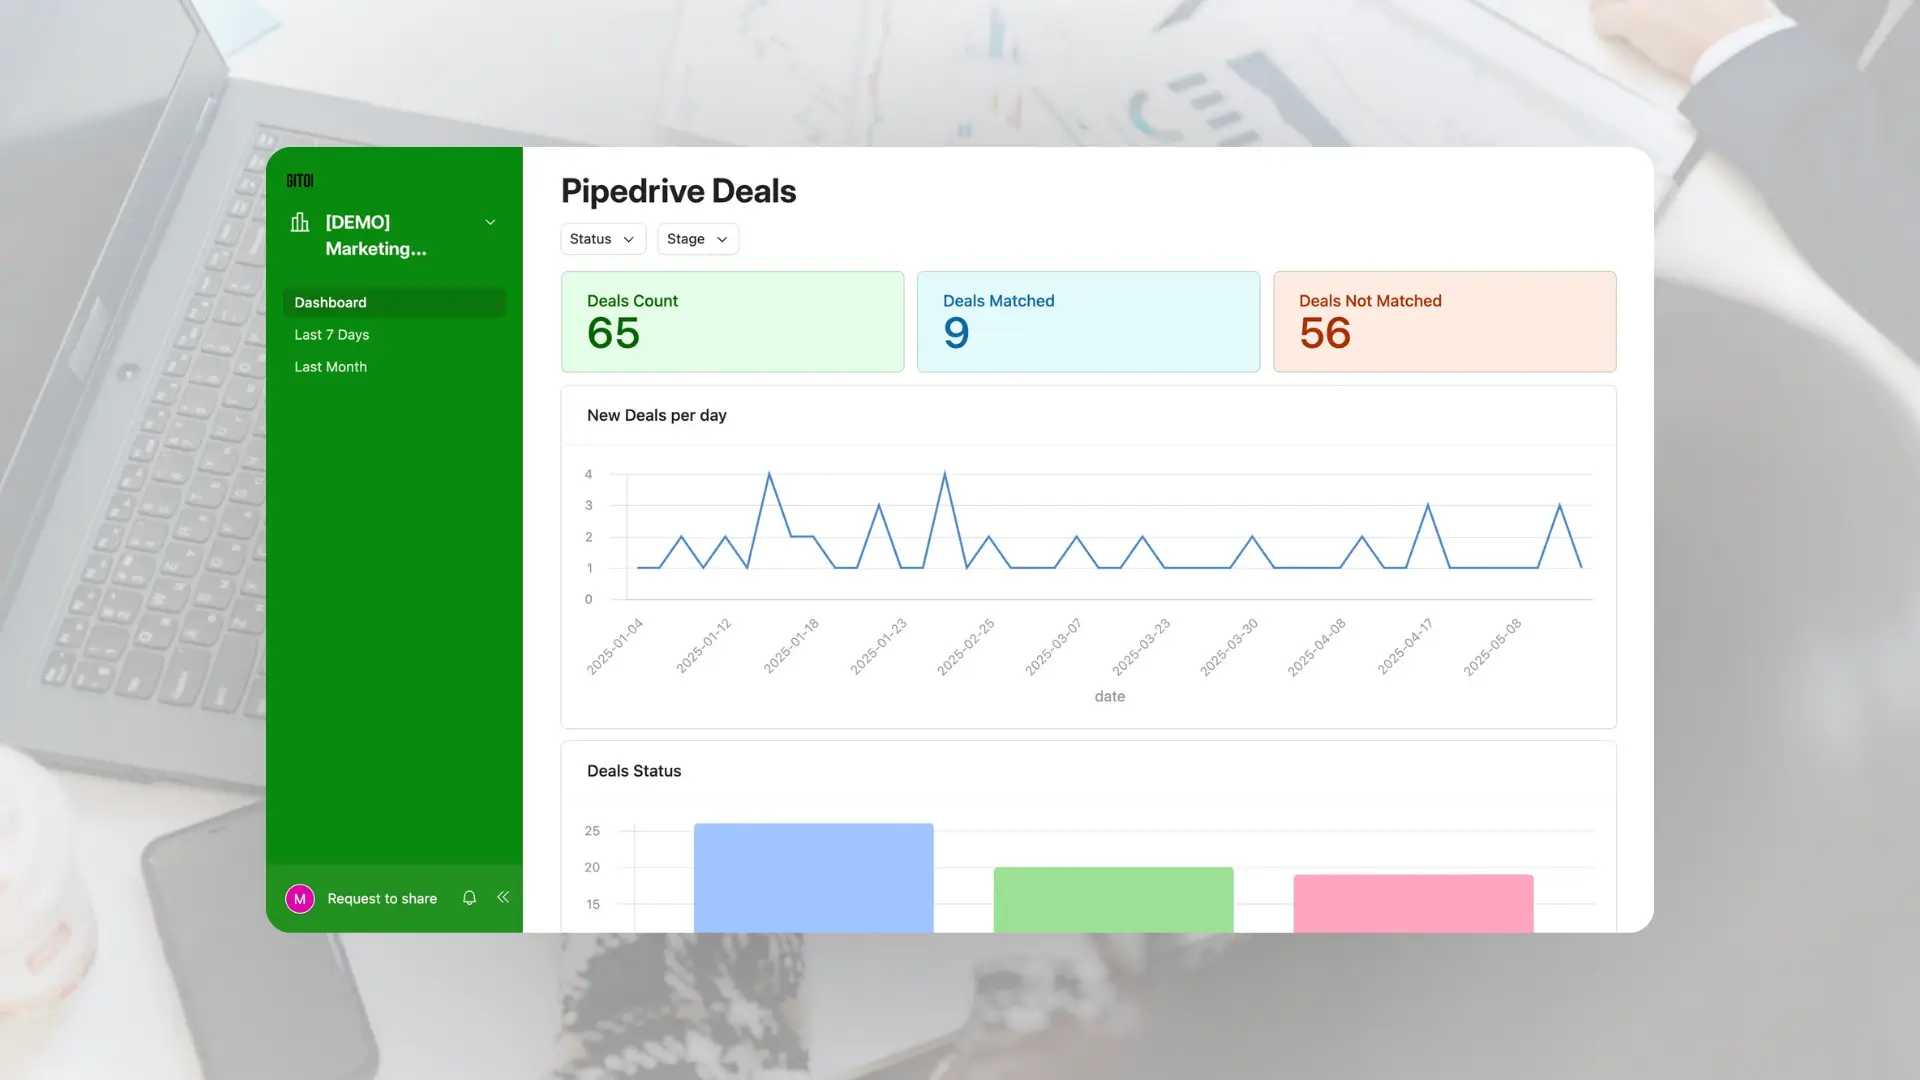
Marketing Data Integration
We have combined different marketing data sources into one data visualization tool.
Do you want to implement similar reporting automation in your company?
Ask for a dashboard demoWhat you will gain by implementing a business dashboard with us
Fast but dedicated implementation
We build dashboards based on a low-code tools (mainly Airtable), which allows us to implement them quickly and flexibly. At the same time, every view, logic, and way of presenting data is adapted to your process — this dashboard adapts to your team, not the other way around.
Visualize data from multiple sources
We combine data from different tools in a single dashboard with dedicated integrations with the systems you already use in your company. This gives you a single place to filter, compare and analyze data without having to switch between apps.
Automatic notifications for management
If your processes require it, the dashboard can monitor data and react to relevant events in real time. Automatic notifications can inform the team about budget overruns, reduced bid profitability, or delays in execution, among other things.
Automations that extend the functionality of the dashboard
If necessary, we extend the dashboard with additional integrations that go beyond the data analysis itself. Thanks to this, it can, for example, automatically send emails to customers, update statuses or start the next steps in the bidding process.

Why streamlining the reporting process is crucial to efficient company management?
With chaos in the data, strategic decisions “drag on”, and often they are even made only on the basis of intuition. However, the automation of business reports comes to our aid because it organizes information in the background, allowing reliable data analysis in one place. Thanks to business process automation (BPA) technology, it is also possible to generate clear data visualizations on dashboards or in PDF reports. With such an automated reporting process, companies can manage the enterprise based on always up-to-date information, which provides them with higher work efficiency and fewer strategic errors.
Thanks to Business Intelligence tools, we create automated operational reports for our clients — read reviews about our services
Case Study
Deployment automation of business reports for a client from the service industry
Our client's problem

Our client's reporting process required manual collection of data from several financial departments and two different accounting tools. The analysis was time-consuming, error-prone and performed only once a week. As a result, the company did not have the ability to react quickly to significant financial deviations.
Our solution

We integrated data sources into a single, central system and fully automated the process of their processing, this ensured the client's data is updated in real time. In addition, the lack of employee participation eliminated manual errors. We have also implemented alert mechanisms enabling immediate response to critical situations.

Solutions introduced by us
Centralization of financial data
We integrated data from two accounting systems into one repository, eliminating the need to manually collect statements from multiple departments, which significantly increased the efficiency of the team's work.
Automatic data import and update
Financial data is automatically synchronized and updated in real time, without the need for manual intervention — thanks to this, the process of creating financial reports runs in the background.
Elimination of human errors
Automation of the reporting process has completely eliminated the risk of mistakes due to manual entry into Excel and comparison of data by company employees.
Deviation notification system
We have implemented alerts that automatically inform the client by e-mail and through a messenger about exceeding key financial thresholds, which speeds up decision-making in case of deviations.
Details of implementation
Deployment time
3 months
Time saved
300 h per month
Cost of implementation
EUR 19 000
Return on investment
after 10 months
Schedule a consultation with our specialist and get free demo of your dashboard
During the online consultation, our specialist will analyze the needs of your company and then prepare a demo of the data visualization dashboard for you. After testing, you will decide whether you want to implement a full version of business report automation with us.
Make an appointmentLearn more about the implementing automation in the company with our articles
See all entries


.webp)
Fill out the contact form and get control of data chaos with us!
Thank you for contacting us!
Your message has been successfully sent. We will reply as soon as possible.
